

Count Draghula
@countdraghula
Followers
19,470
Following
505
Media
1,168
Statuses
8,482
Macro trading is dead, because markets aren't allowed to find fair value.
Joined December 2021
Don't wanna be here?
Send us removal request.
Explore trending content on Musk Viewer
Kroos
• 515310 Tweets
Reich
• 158682 Tweets
England
• 145381 Tweets
Apple Music
• 81430 Tweets
Boeing
• 78102 Tweets
Rashford
• 56388 Tweets
Singapore Airlines
• 52098 Tweets
招待コード
• 51372 Tweets
#KKRvsSRH
• 49294 Tweets
Modric
• 45645 Tweets
Southgate
• 38861 Tweets
ROCKSTAR PRINCE SUHO DAY
• 33949 Tweets
Klaus Schwab
• 33649 Tweets
كروس
• 31989 Tweets
Grealish
• 31301 Tweets
Poch
• 25839 Tweets
Iniesta
• 25212 Tweets
Vivian
• 22301 Tweets
Shaw
• 21193 Tweets
花帆ちゃん
• 21035 Tweets
Hellblade 2
• 20825 Tweets
Prat
• 15389 Tweets
Luna Park
• 15051 Tweets
25Mayısta KonferansaDavet
• 13066 Tweets
Shreyas Iyer
• 12520 Tweets
Denji
• 11506 Tweets
チェンソーマン
• 11297 Tweets


Pinned Tweet

Chinese supply-side growth is the engine for Chinese growth and to this end there is only one thing you need to follow:
STEEL.
If you want to know when to care about the effect of China on US equities & credit, read on.
1/

7
45
240
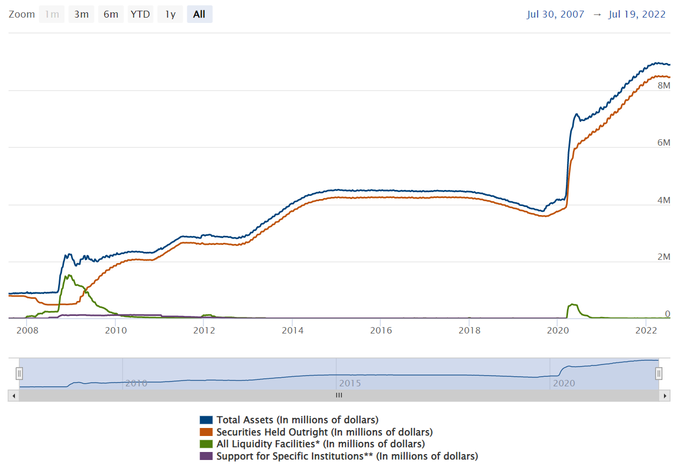
QT will probably end in early 2023, and not because of recession.
It will stop because the Fed can't shrink its balance sheet past $8trn ($8.9trn now) without introducing problems for the system.
The math is below.
1/
(Fed total assets)
77
727
3K
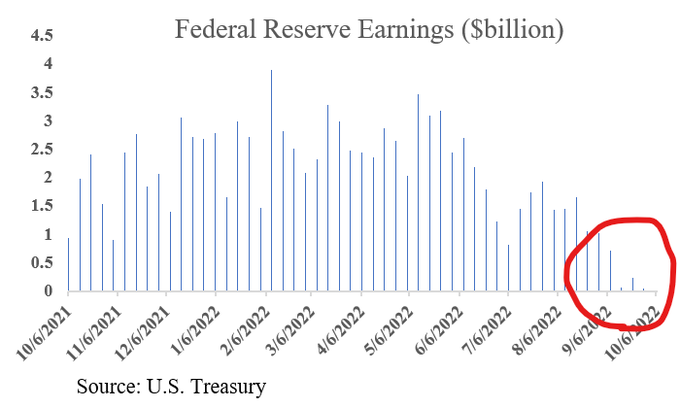
The Fed now earns less on its assets than it pays on liabilities.
It's a problem, and the only realistic way to fix this short-term is to slow down hikes.
If they don't fix it, we start "proper", unbacked, money printing.
1/
(chart
@FedGuy12
)
68
479
2K
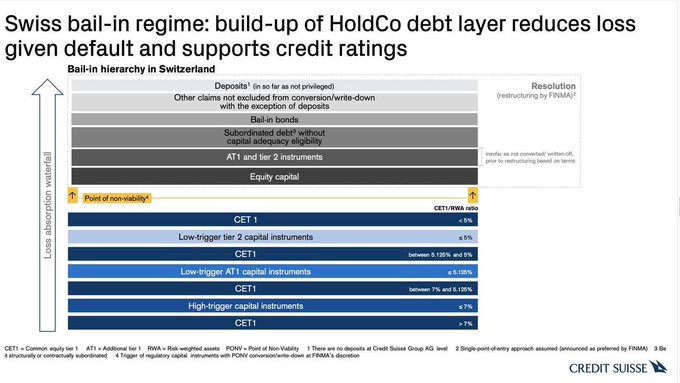
The Credit Suisse bailout was agreed to, with equity getting CHF3bn (probably to satisfy the Saudis).
Despite equity getting something, roughly CHF16bn of Additional Tier 1 debt has been written off to ZERO, defying the usual waterfall.
Will this ripple? Is it a problem?
1/
17
124
577
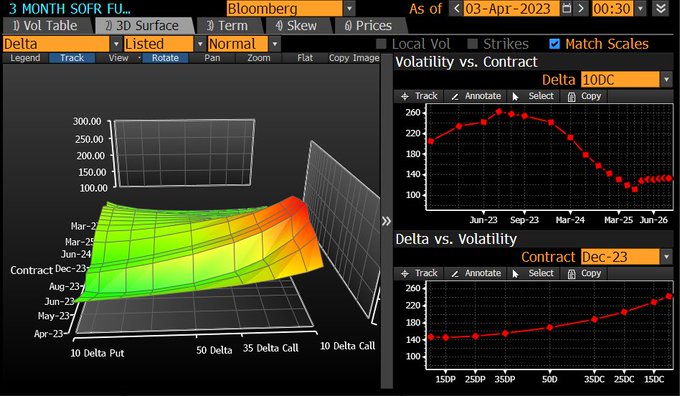
Insurance protecting against brutal Fed cuts this year are still SUPER rich, despite the relative calm.
Calls that protect against a Fed that suddenly cuts >175bp in a year are RIDICULOUSLY expensive compared to puts (which protect against higher for longer).
Explainer.
1/
20
104
562
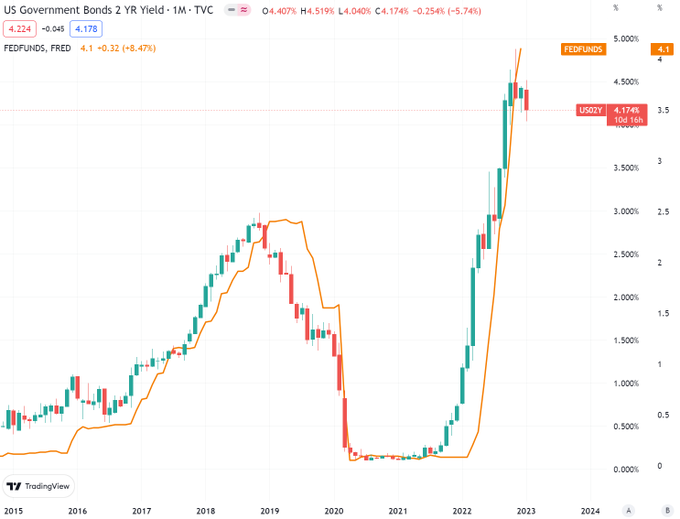
An old rule-of-thumb for bond traders is to buy the 2-year bond just after the second-to-last rate hike.
How well has this worked?
A STUDY of buying short bonds throughout history (1977-2023).
This study puts today's yield curve inversion and the 80s into context.
1/
22
106
550
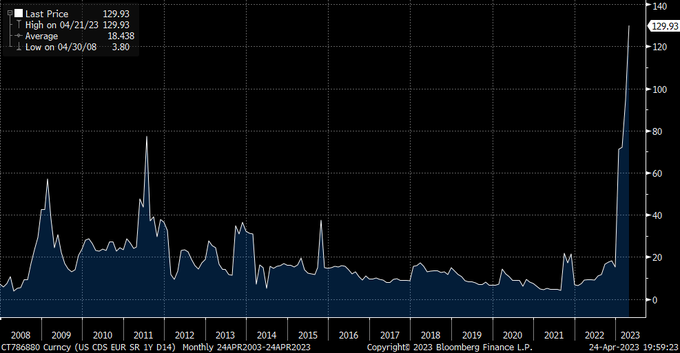
Credit Default Swaps (CDS).
Lots of attention on US Sov CDS given the debt ceiling. 1Y has traded higher than in the 2011 episode.
CDS at the best of times is a bad market. DM sov CDS is even worse.
1/
12
134
546
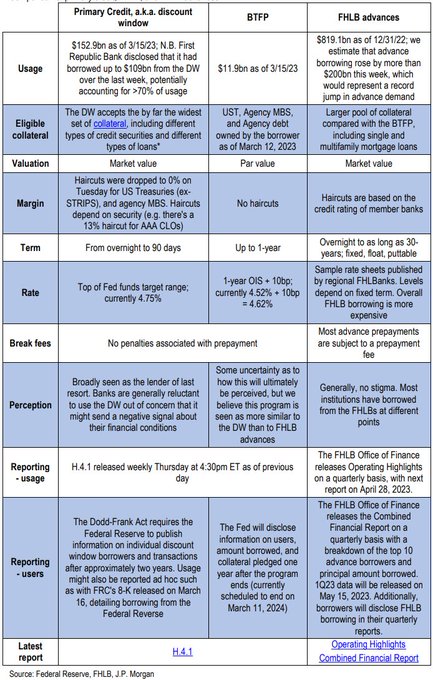
JPM produced a handy table (below) comparing the discount window, BTFP and FHLB advances.
It also includes current usage, costs and perceived stigma in their use.
8
124
499
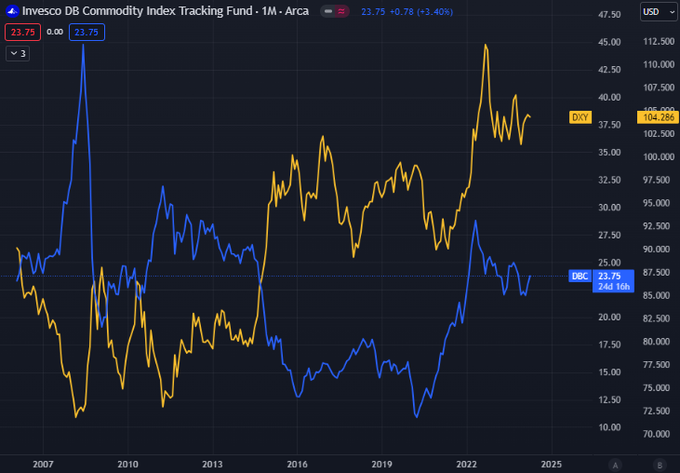
We are living in an odd time - where the USD has a positive correlation with commodities rather than a negative one.
So many things have broken this cycle (60/40, leading indicators etc etc), and for good reason. The USD is just another one of them.
1/
13
59
504
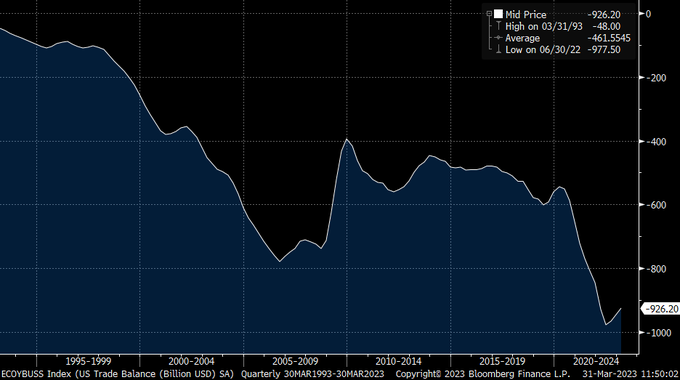
Trade (and the capital flows that follow) must persist or we risk collapse.
For the last 40y the US has run an external deficit, importing capital (and exporting USD) to the big 3, Japan, Germany and China.
This can't change. If it does, stable debt becomes unstable.
1/

17
99
447
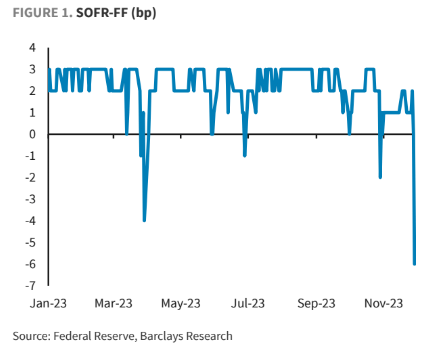
SOFR is trading quite a bit above Fed Funds. Why?
Huge UST rally -> extreme HF short futures/long RM physical -> demand for secured funding and bank b/s can't keep up, driving up SOFR.
This will speed up already fast RRP depletion and QT will start reducing reserves again.
1/
17
72
399
13/ The fantasy that the Fed can sell $8trn worth of Treasuries through QT is just that. Fantasy.
In reality the balance sheet can be shrunk around $900bn. After that, QT is over.
27
40
386
The BoJ has run the most successful policy out of any CB, hands down.
Also unlike every other CB, it also chose a disinflationary period to adjust policy, while trading it to avoid high rates vol.
This policy makes sense for Japan...just forget about BoJ's balance sheet.
1/
16
66
363
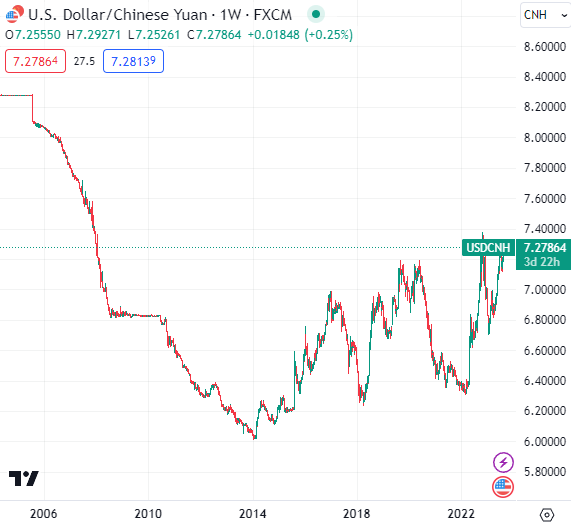
Why does China defend against deval?
1. Devals create more incentive to bypass capital controls and get money out
2. Keeping the trade balance in check
3. Stop a deval spiral
Until 2022, every country was competitively devaluing. Why not China?
1/
13
67
362
The Treasury Buyback idea is one of the worst ideas I've seen.
We are talking govt here, so there is no plan dumb enough, of course.
But if you loved the financial engineering of a Big Fed balance sheet, you will love this even more!
1/
21
76
327
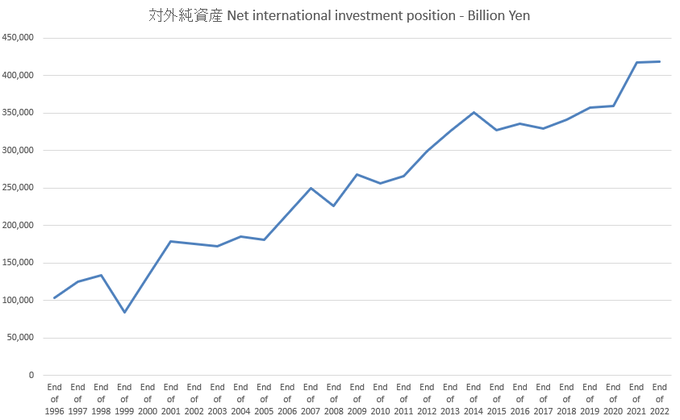
The Yen's fall will go some way to keep Japan's trade balance positive, and its net international investment position (NIIP) climbing.
The NIIP represents assets that can be sold if Japan finds itself in capital outflow because of trade - making the buffer to crisis immense.
1/
10
48
327
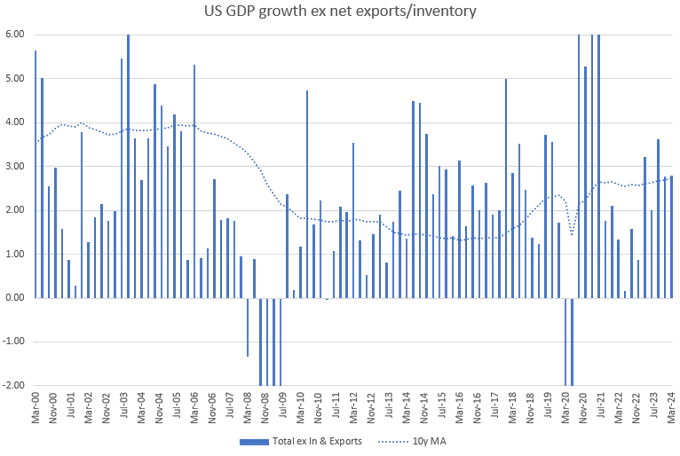
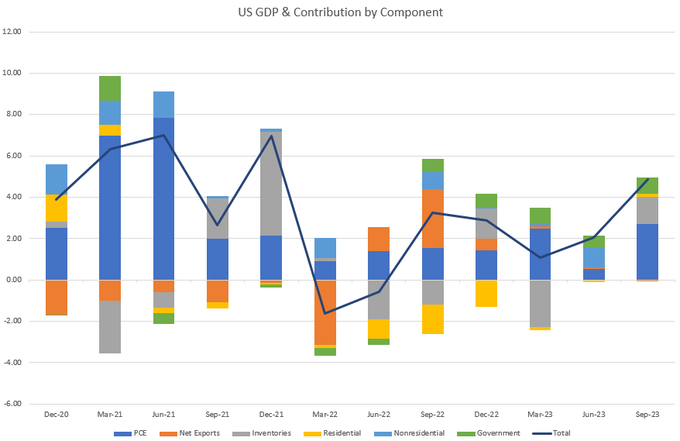
Mute "stagflation" on your feed, this was another incredible US GDP result.
Growth ex net trade and inventory = 2.8% (2.77% last Q)
Govt contribution down, but residential investment picking up the slack! Non-res still printing positive.
Cyclical parts of GDP crushing it.
1/
10
53
324
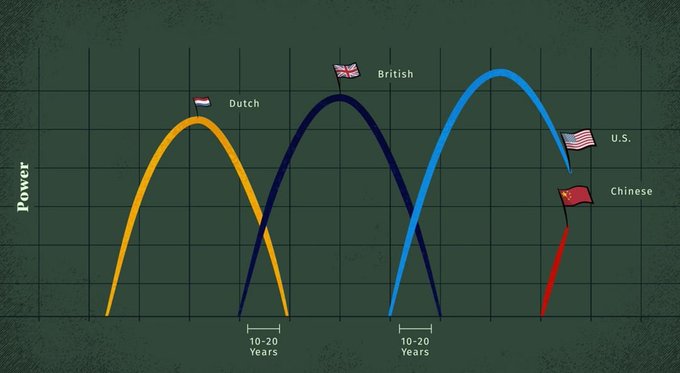
On a day like today I always remember Mr Dalio's slide and how he left out the very short rise and fall in both the USSR and Japan which severely complicates his little theory here.
You don't raise billions of dollars in your fund without having a convenient narrative, I
42
25
308
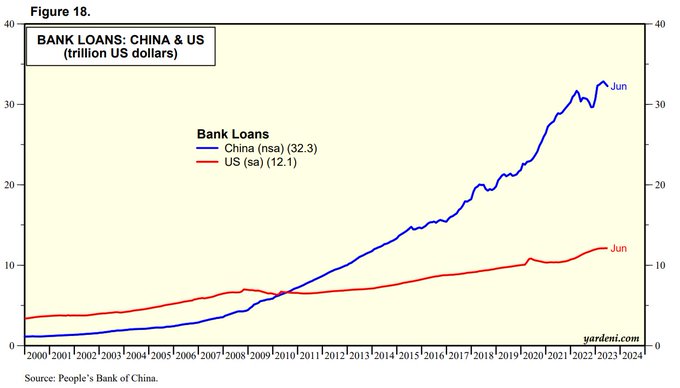
"Chinese bank loan growth has only fallen from 13.7 to 11.7% over the last 10 years"
Oh yeah?
Well that ~12.5% compounded growth means that the per month amount of new loans has >3x'd in Yuan terms to keep the growth going.
All for little GDP growth.
1/
12
55
300
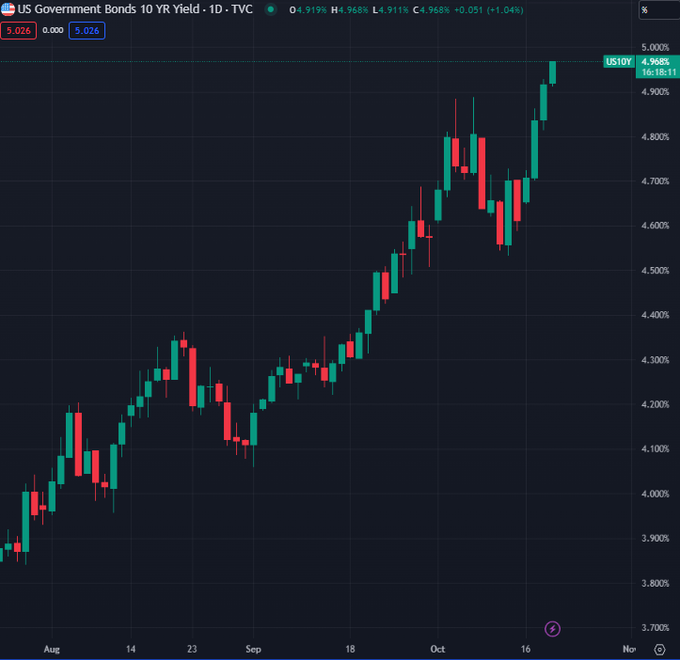
A reminder that US10s will go through 5%, and then quickly on to 5.20%.
* Issuance falling because of tax revenue beats are more bearish bonds than more supply by a huge margin, especially when the curve is still inverted.
* There is no indication of a slow down...
1/
14
32
300
QE did NOT create deposits.
QE created an asset for the banks (reserves), not a liability, which is what a deposit is.
The banking sector created deposits when it funded the purchase of massive treasury issuance.
New government debt created the deposits.
1/

One structural change in the banking system is that interest rates paid on bank deposits are much less sensitive to Fed hikes. This is largely because QE increased deposit levels so much that banks have less need to compete for them.
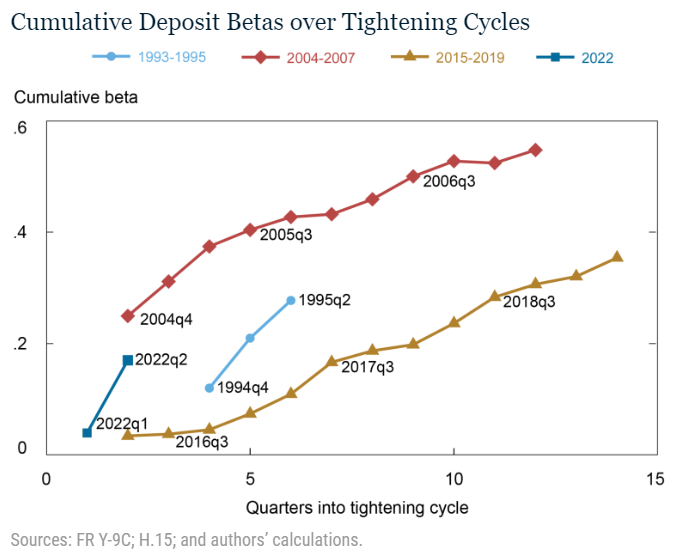
14
42
246
25
46
291
=> The Fed does NOT fund the govt's deficit through QE or anything else.
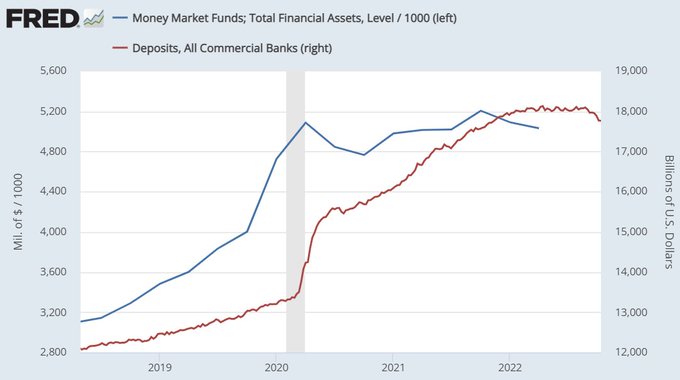
=> Banks and money mkt funds do with depositor's/unit holder's money.
Deposits and MMFs grew by $7t over the pandemic, (below)...this funded most of the $7.5t of fresh Treasuries.
1/
9
56
286
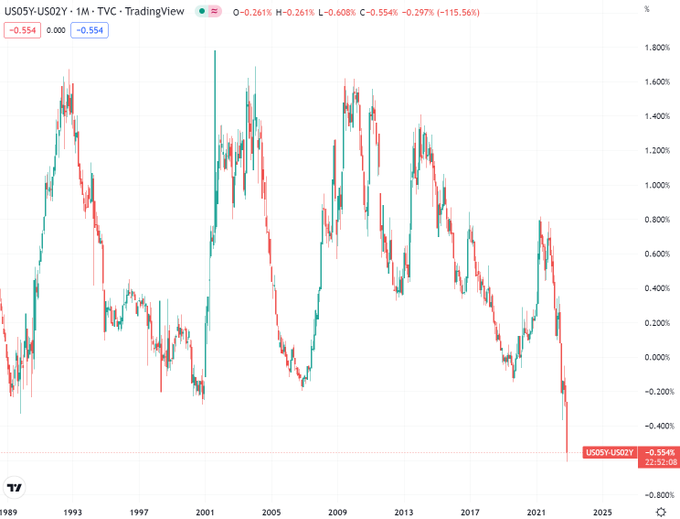
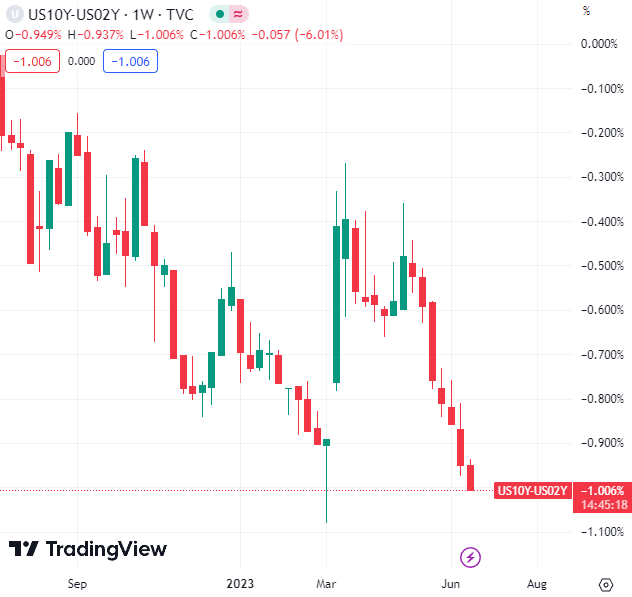
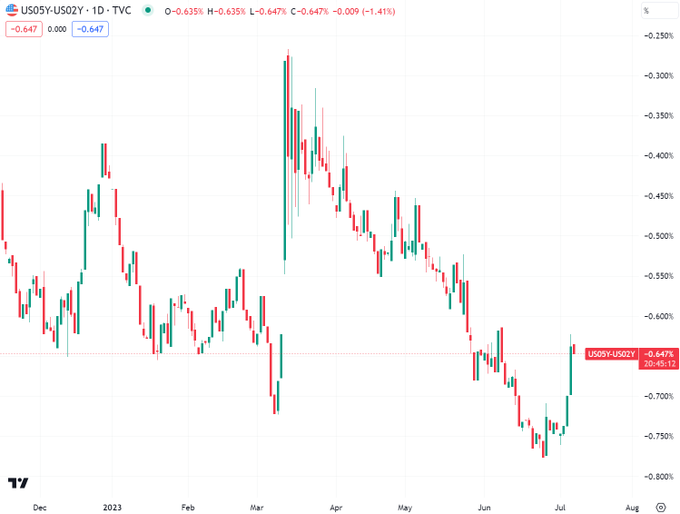
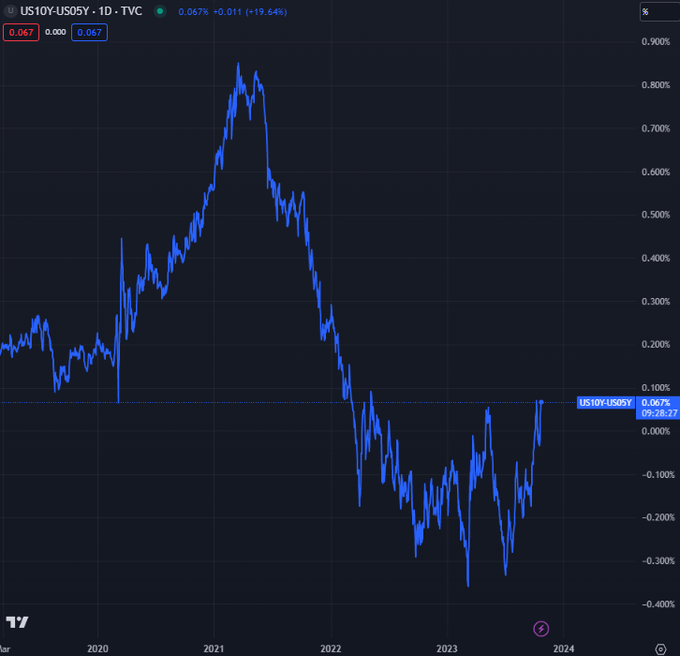
The US 2y-5y yield curve is inverted like never before.
If the curve intends to act like previous cycles and steepen up on cutting, we need 150bp+ of cuts in '23.
That says serious recession, with an aggressive Fed too.
If not, its pricing CERTAINTY of stagflation.
1/
10
60
290
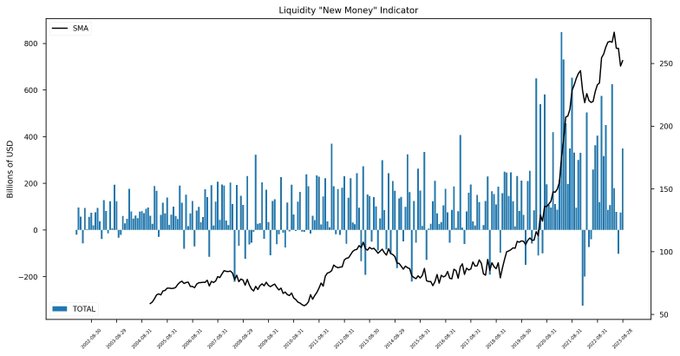
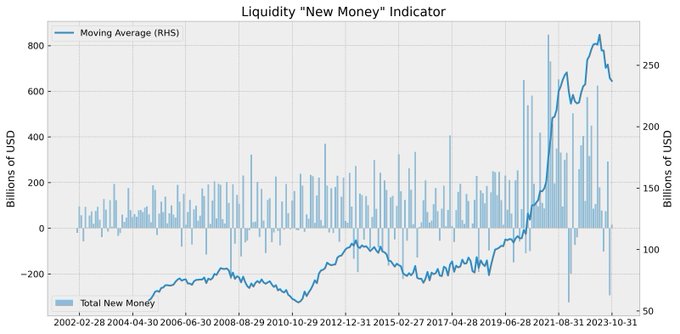
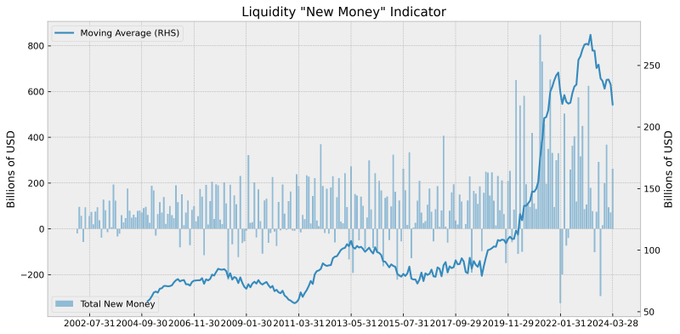
The term "liquidity" has officially been beaten to death.
Here is my new "new money" index which tracks the creation of new spendable, asset buying money in the US, and trades the S&P.
It doesn't include QE, RRP or any of that rubbish.
Here's how it performs.
1/
17
44
287
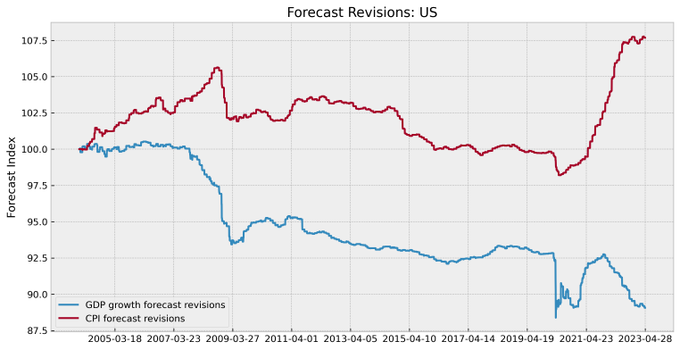
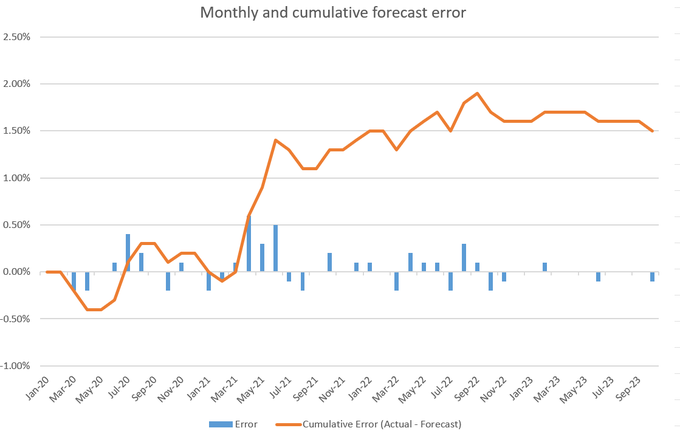
The average economist on Bloomberg has got their 1 year fwd US GDP forecast high by a cumulative 11% since 2004....roughly 6 years of growth at potential.
The story for CPI forecasting is no better, especially in 2022.
Amazingly, it's worse elsewhere...
1/
4
39
249
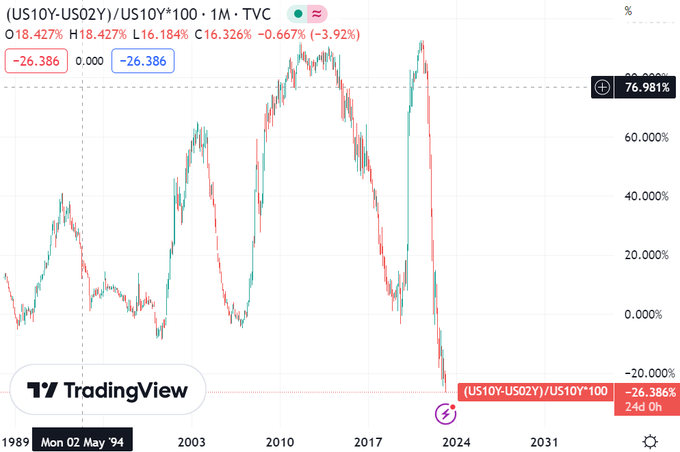
US 2s10s curve breaks through -100bp, or -26% of the 10y yield level.
This has now broken the WORST of the 70s at -22%.
Can 2s10s flatten more? YES, as long as the curve shape stays the same.
The curve is an anomaly of <2y bonds.
Learn how instos considers carry & roll.
1/
7
68
244
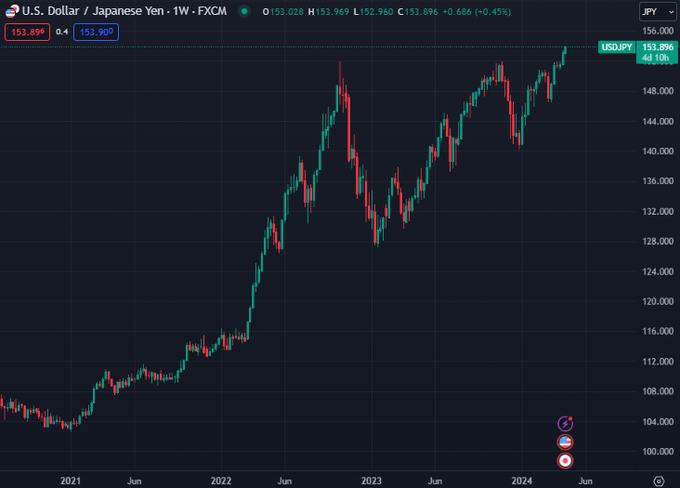
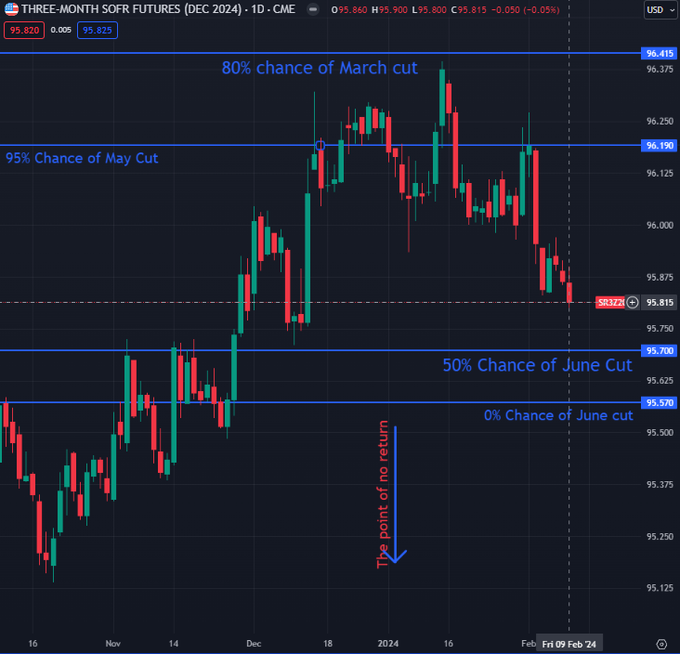
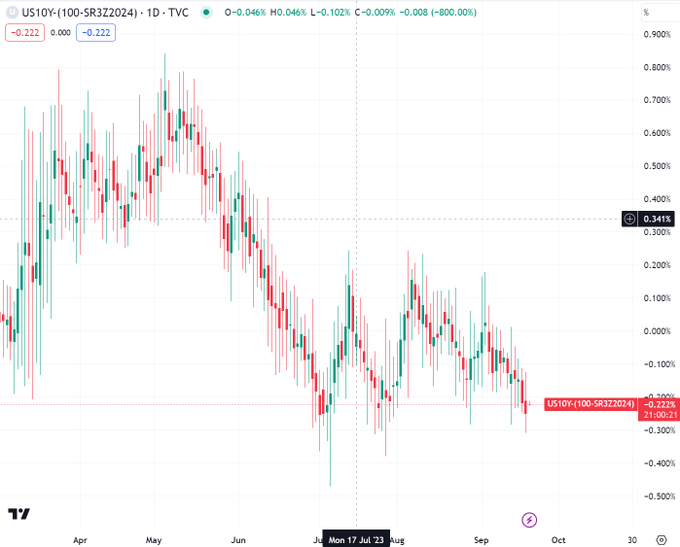
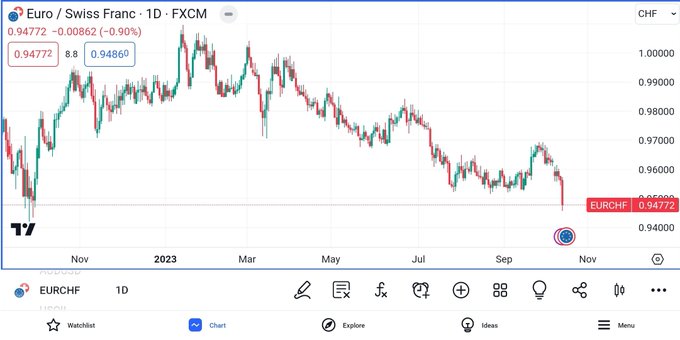
USDJPY pretty much out on its own here.
Post-CPI breakout is definitely confirmed now - when Dec-24 SOFR busted through the point of no return.
The BoJ's meagre tightening measures not working here as it's even underperforming CHF who have already cut rates.
Mega FX thread
1/
6
36
247
BTFP is not QE. B/S expansion != QE, mostly.
BTFP is closer to what TARP was in 2009.
By accepting an under-collateralized position, the Fed is making unsecured loans for the difference to insolvent entities.
Bottom of the cap structure means this loan is equity.
1/
14
50
239
I'm genuinely excited to see how the Bank of Japan is going to screw over markets this week
18
15
234
This bond rally has put an extra rate cut into 2024 and 2025, taking the total to 4 & 2.
This move explains the entirety of 2s10s flattening (-28bp); making moves once again a recession worry story.
Oil has a lot to say for it, with bad eco news drowning out good.
1/
10
29
235
2y fwd rate expectations show 2% worth of rate cuts, matching SVB and late July weakness.
Collapsing oil, confusing 4Q growth data and a discard of inflation (US & EU) as a theme are drivers, rather than "!!recession!!" as it was in the past.
This difference is important.
1/
5
34
217
Replace USD hegemony in 3 easy steps!
Step 1:
Find another country to absorb roughly $1trn of trade demand from surplus exporter countries.
Those surplus (hegemony competitor) countries won't look so hot without this demand otherwise!
13
45
222
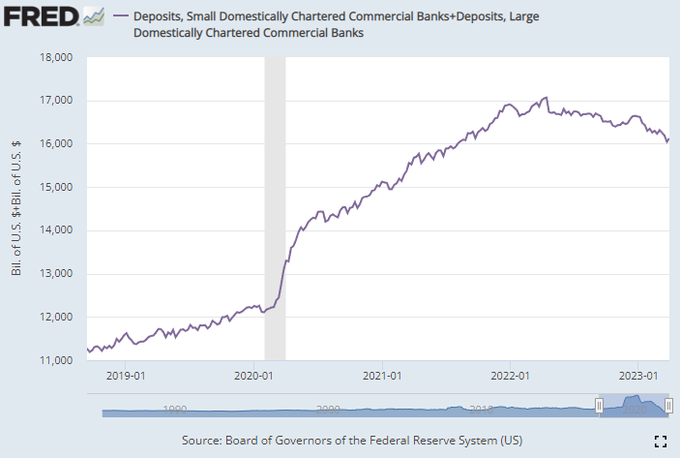
People panic over deposits, but the banking mini-crisis hasn't shifted the year long trend in deposits much.
Don't concentrate on this (or M2) as an indicator.
It doesn't tell you about the structure of bank balance sheets changing, or what really effects the economy.
1/
5
41
215
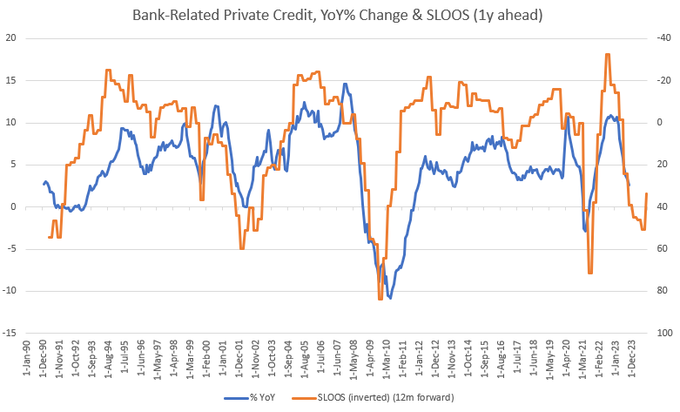
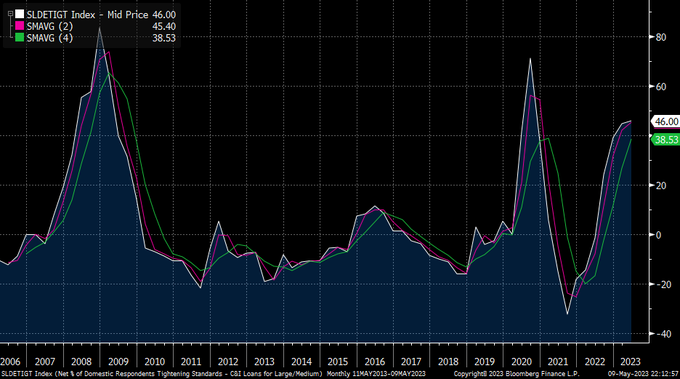
The SLOOS has marked a turning point for private credit growth.
For banks easing lending standards it was due to "better credit quality".
The SLOOS provides a reliable indicator of turning points in credit growth, which is the most bearish trend right now bar none.
1/
9
27
218
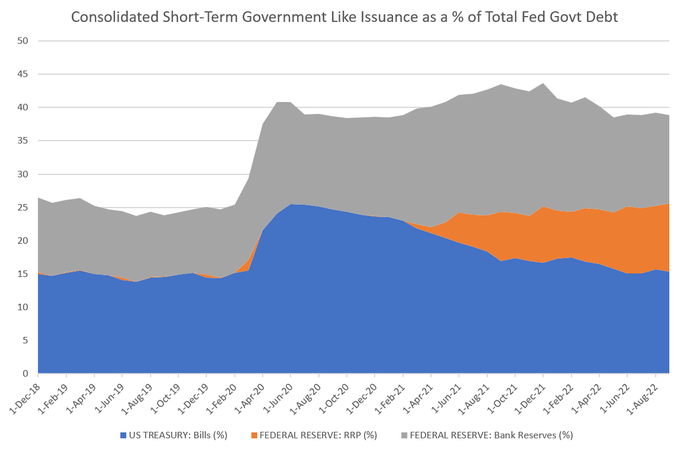
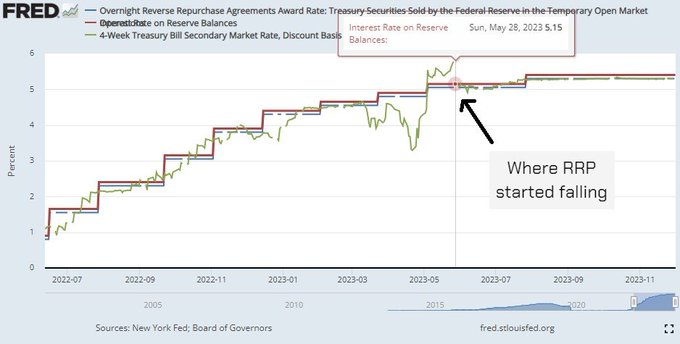
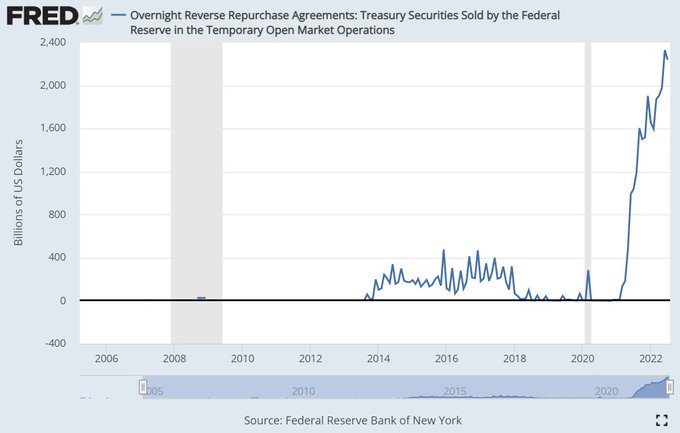
Fed RRP usage has fallen and reserves have increased, despite QT. This is because of:
Price: Interest on reserves pays more than RRP and bills (chart) AND the Fed slowed hikes
Volume: Mega supply of bills offers an alternative to MMF's
RRP trend will allow QT to continue.
1/
6
35
209
Bank equity rout does not equal systemic issue.
Hedged or not, almost no bank can survive a large run on deposits. Banks sell vol and are short liquidity...
...so if they hold loans or USTs, if they suffer a run of >25% of assets, they are usually toast.
1/
11
26
207
What is a country like after prices double and GDP falls nearly 10%?
I just came back from a trip to Sri Lanka, picking it to support tourism after a devastating few years.
It's an amazing place and you should visit.
Economically though, it's still very very tough.
1/

16
33
202
6 months in and the Fed's QT isn't going to plan.
Assets ⬇️ -$333bn = -$55bn/mo, ~$16bn short.
Liabilities:
Bank reserves ⬇️ -$123bn
RRP ⬆️ +$186bn
TGA ⬇️ -$370bn
B/S shrink is mostly from Treasury drawing down on its deposits? Is this a fail?
Sort of.
1/
12
35
197
US10y knocking on the door of 5%.
Unlike the last rise in yields pre-Oct 7, this is being matched with a rise in the front-end and a good probability of *one* *more* *hike* just as more cuts get priced out of '24 and '25.
The economic good news story continues.
1/
4
19
188
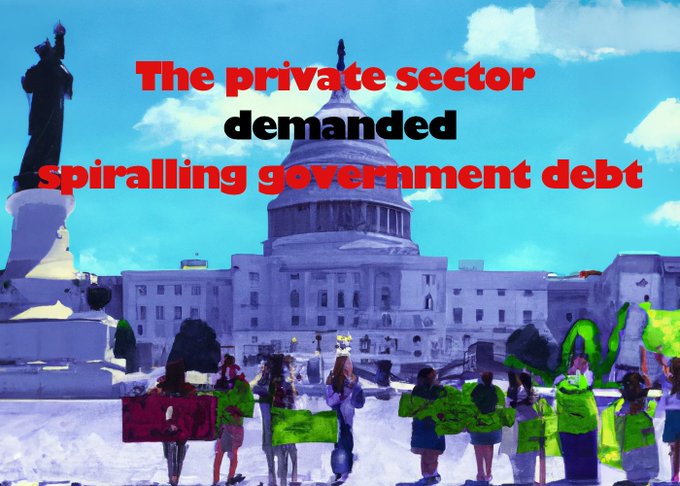
Huge fiscal deficits are entirely the private sectors choosing.
By running a surplus and choosing saving over consumption or investment, the private sector has forced the hand of government to run a deficit.
If it doesn't, painful below trend growth is a certainty.
1/
16
31
182
Real yields don't really matter anymore, if they ever did.
The only relevant marginal borrower is the govt...
...and they borrow more to make up for a deficit in private debt expansion.
1/
15
23
186
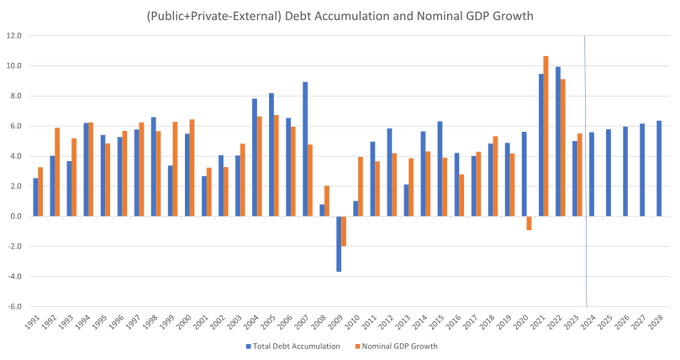
Everyone knows fiscal drove nominal GDP growth, and deficits will stay large.
But HOW MUCH will fiscal drive growth? And what happens if the private sector continues to de-lever?
The answer is that it will allow average nominal GDP growth at better rates than 2011-17...
1/
6
22
176
6/ Reverse Repo.
Due to regulation changes post-GFC, money market funds were dissuaded from investing in short-term bank paper, requiring govt paper only.
There isn't enough T-bills to satisfy this need. So the Fed creates an asset (RRP) for money market funds to invest in.
5
8
168
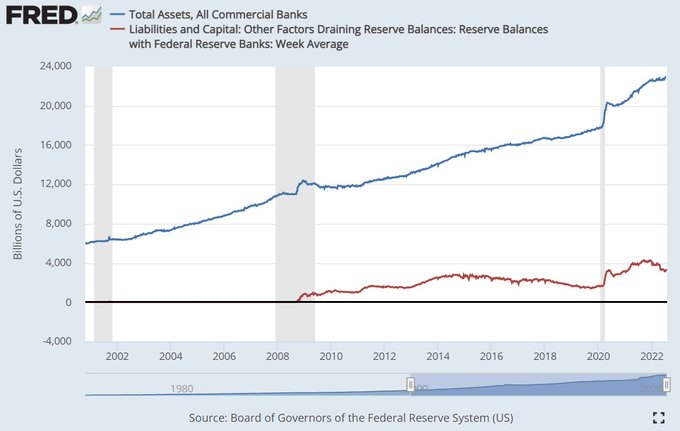
2/ Everyone concentrates on the assets that the Fed has on the B/S. It's basically all Treasuries and MBS.
But, like any bank, assets must = liabilities. It's the liabilities which tell us how big the balance sheet must be.
4
7
166
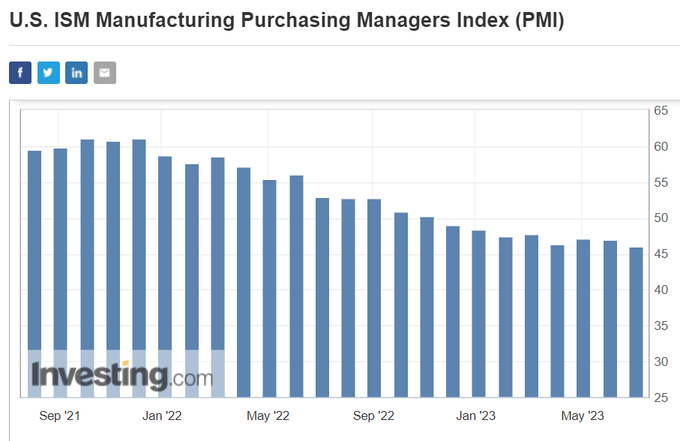
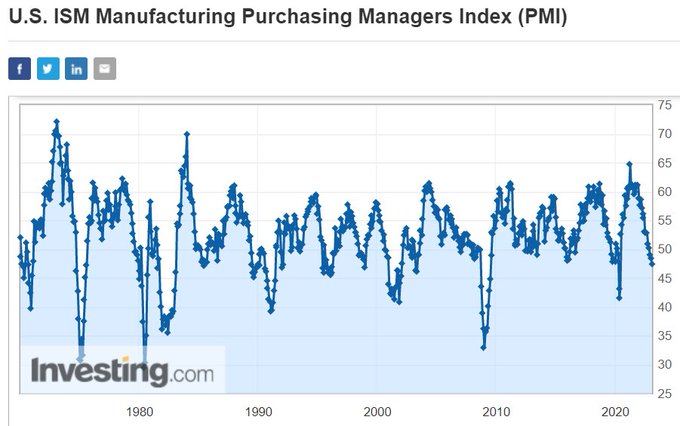
"All sub-components of the PMI are <50"
Yeah, but it doesn't really matter.
The change to the momentum of PMIs are most important and on this measure we are tracking to lethargic growth which is in line with the hard data.
1/
12
29
171
Macro is the toughest asset class to generate alpha. It requires constant stops and incredible discipline. Why?
1) Long-term trends are very rare, happening 1 in 10 years
2) As such, they "range trade" over decades
3) There is no "earnings growth" to fall back on.
1/
7
16
162
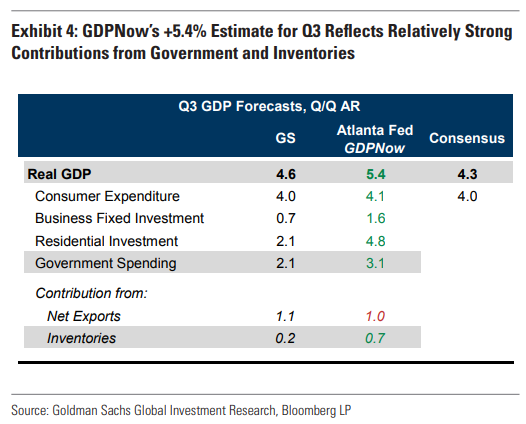
GDPnow is up at 5.4%, with consensus scrambling to catch up.
While 1.7% comes from forecasts for inventories and exports (avg 0 over long term), 3.7% ex is still very, very strong.
Govt is a large reason, but it's that biz fixed investment that is the most important...
1/
4
34
162
5/ Currency outstanding.
This is at $2.3trn, and represents the amount of printed notes and coins in circulation. This obviously cannot fall without destroying notes and coins which is not going to happen.
So the B/S must be at least $2.3trn in size.
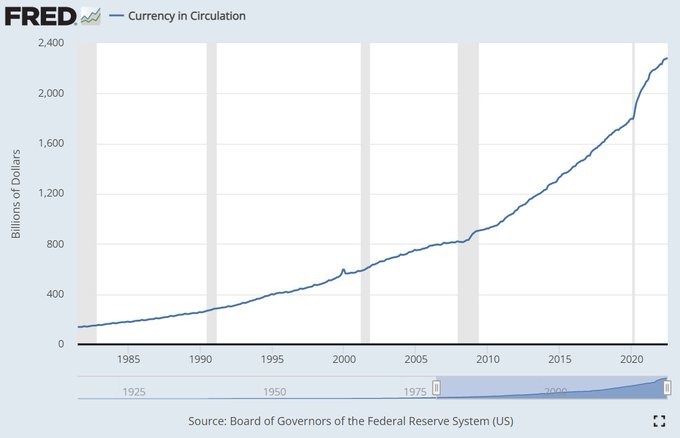
6
7
153
12/ Adding the minimums...
Currency ($2.3trn) +
RRP ($2.3trn) +
Minimum bank reserves ($2.7trn)
= $7.3trn
Add the current deposit by the US treasury at the Fed ($0.7trn)
MINIMUM B/S SIZE = $8trn given today's dynamics.
It can reduce more if RRP demand goes away (unlikely).
4
7
154
4/ What are the liabilities?
1. Physical currency outstanding
2. Reverse Repo balances
3. Reserves held by commercial banks
Each has a minimum in the new post-GFC world.
1
6
153
QRA and 10s trading, timeline and the facts.
QRA released 8:30am.
10s rally from 4.90% to 4.84%, reverses to 4.88% and then rallies again to 4.84%. 6bp.
2s10s flatten by 5bp over this time. <- This is the QRA effect with certainty. 5bp. That's it.
Next, ISM.
1/
15
21
157
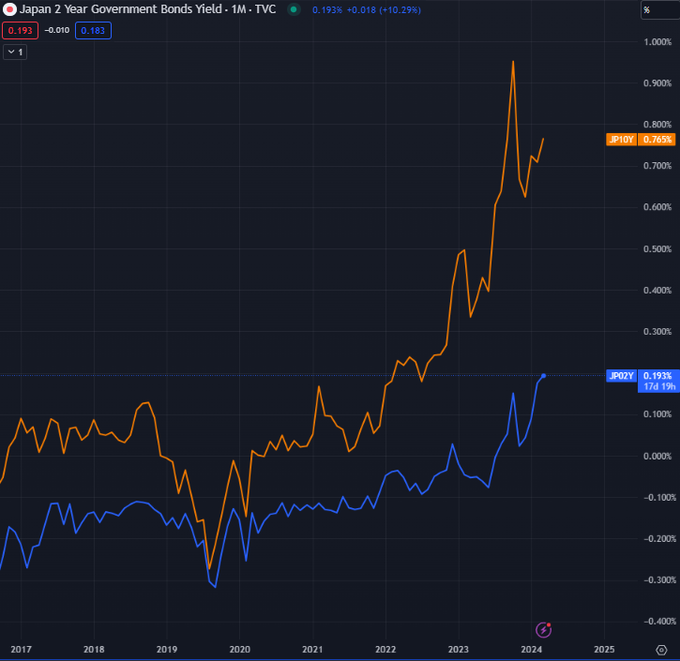
An everything JGB and JPY thread.
Rumours are for the BoJ to end NIRP & YCC at the Mar 18-19 meeting.
2y new high, 10y heading to 1% fast.
USDJPY only off ~2%. USDJPY vol the surprise...shouldn't it be more? Reality is JPY vol has been in decline.
1/
4
31
158
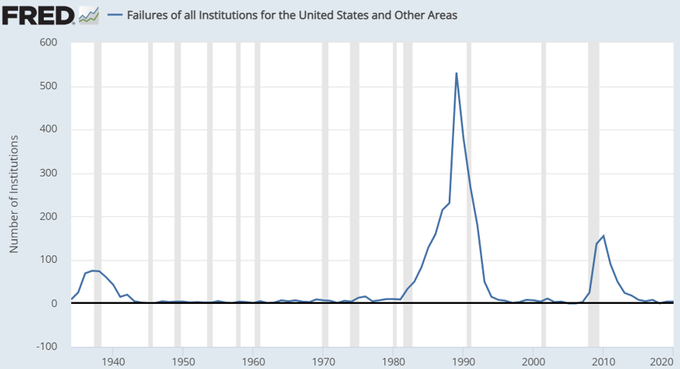
SVB looks a lot like an 80s style S&L crisis. But it's not about credit losses, it's about USTs.
A recession started the problems in the 80s, but hundreds of bank failures didn't cause another recession until CRE affected large banks in the early '90s, 10 years later.
1/
10
18
159
7/ Reverse Repo.
To create this asset they borrow from the MMF to buy Treasuries on "loan", creating a short-term security out of a long-term.
This is $2.3trn. It has grown because rates are increasing and demand for short-term has increased.
This won't change for now.
5
7
150
US macro update.
Just a quick look at the most volatile parts of the economy:
1. Residential investment
2. Non-residential investment
and a bit on incomes/spending.
I have no answers here, as this cycle isn't like others.
Probably no collapse until 2Q next year.
1/
5
21
153
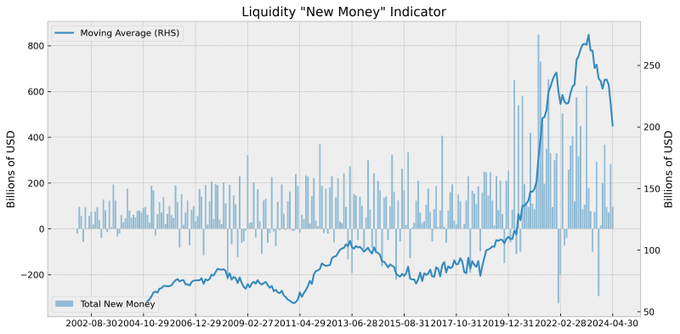
A year's worth of TGA rebuild has finally taken its toll on the "new money" liquidity index.
Budget balance still supportive of long equities, but as delayed TGA rebuild effect has now taken us OUT of equities. Private credit growth slowing as well.
1/
7
19
155
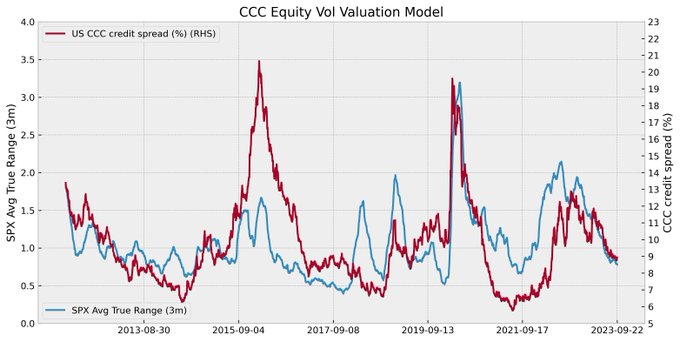
Credit spreads continue to trade with lower realised equity vol, despite trailing low-grade default rates picking up.
Good times in IG credit another likely driver, as is the still elevated spreads vs other "quiet times".
1/
3
21
152
The end of the BTFP probably increases the chance of QT being tapered in March.
This is contentious - Dec FOMC minutes highlighted worry about low RRP usage (does it even matter?), and what's the desired level of reserves?
How does it interfere with rate cuts?
1/
4
23
149
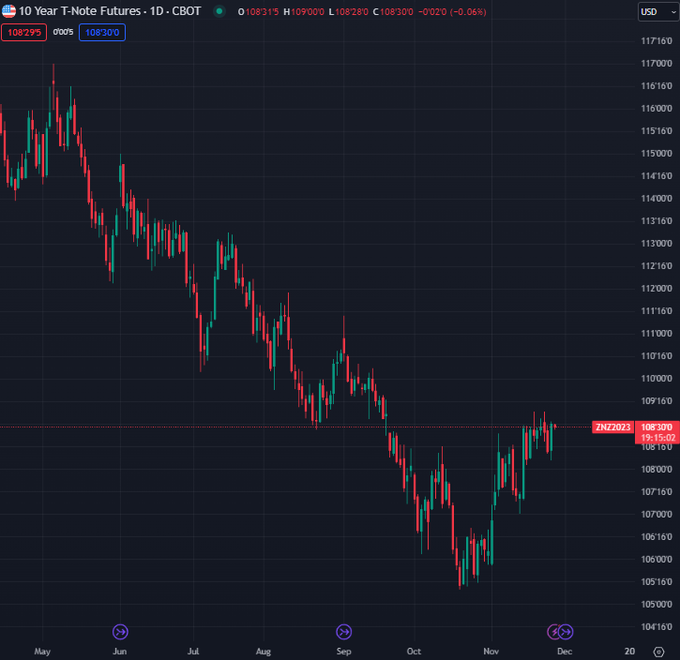
T-note futures have failed to meaningfully break 109 for 10 sessions now. Holiday period aside, it's facing up to be a critical test.
Implying ~4.40% (generic 10y), this 60bp rally is as big as the SVB rally and twice the size of the usual rally in the sell-off since then.
1/
5
12
147
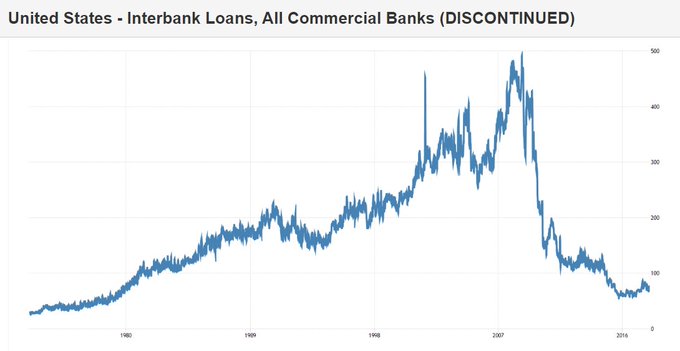
10/ Wile this series is old, you can see how interbank lending collapsed and never recovered. It probably won't.
Banks are wary of contagion, and prefer the safety of reserves over risky interbank lending. Short-term lending puts your deposit attraction ability at risk.
4
6
139
The market has got better at forecasting core CPI over '23.
The miss for Oct drove a huge re-pricing, re-adding a rate cut into '24 (total 4 again).
Market reactions to misses tell you about what narrative is in charge - huge upside misses in 2021 caused a bond rally!
1/
6
8
132
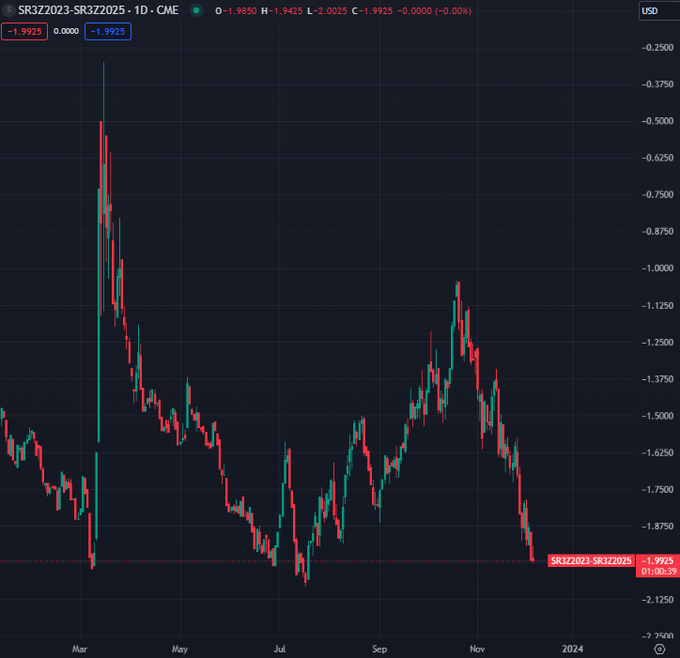
US 2s10s is facing new lows as we trade back through -100bp.
Yesterday's thread went through the weakness and the front-end and why it will continue.
2s10s isn't the right curve to answer any questions though.
It's all about Dec-23 to Jun-25.
1/
7
21
129
2/ How did this happen?
It was totally predictable, and no surprise.
The thread below is a primer on the Fed balance sheet, and worth reading first.
The majority of the Fed's balance sheet is not from QE, but to satisfy demand for safe assets.
QT will probably end in early 2023, and not because of recession.
It will stop because the Fed can't shrink its balance sheet past $8trn ($8.9trn now) without introducing problems for the system.
The math is below.
1/
(Fed total assets)
77
727
3K
1
6
127
From the guy that wrote the book on it...
QE does NOT create real-world deposits. It creates non-fungible bank reserves.
The govt created deposits, along with the assets (UST) that the banks bought.
The only way these deposits 'disappear' is if the govt repays its debt.
1/
@jnordvig
@BobEUnlimited
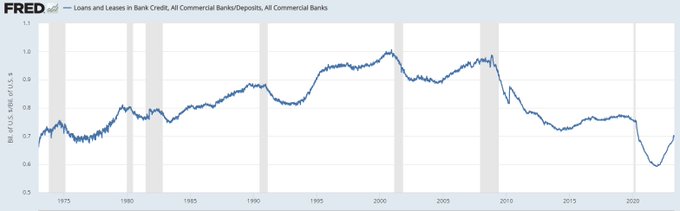
Also worth thinking about just how many deposits does a bank need? Structurally we are coming out of a period of ginormous QE, so loan/deposit rations are very low.
There are compositional issues ofc, but even small banks are at levels prevailing before 2020.
4
5
29
13
22
131
11/ The banks are also deposit rich, with no where to lend (the exact opposite of 2006). This has driven demand for Fed reserves as the short-term asset of choice.
Barcap puts the minimum for bank reserves at about $2.7trn before huge demand for safe assets hurts the system.
5
6
129
The behaviour of CBs over the last year highlights that, despite the hoards of economists that work for each bank, the setting of monetary policy is a highly emotional and sentiment driven decision.
This makes sentiment king and turning points in policy hard to pick.
1/
4
20
130
There are a few hours every day between when US deriv traders stop making markets and Tokyo takes over.
During this time liquidity is non-existent and weird things happen.
This is exacerbated on a Monday.
Please be careful during this time.
8
9
126
The US ISM PMI is still one of the best summary indicators of the business cycle.
The general rule is that a value <50 = recession.
But how bad will this recession be?
1/
5
16
129
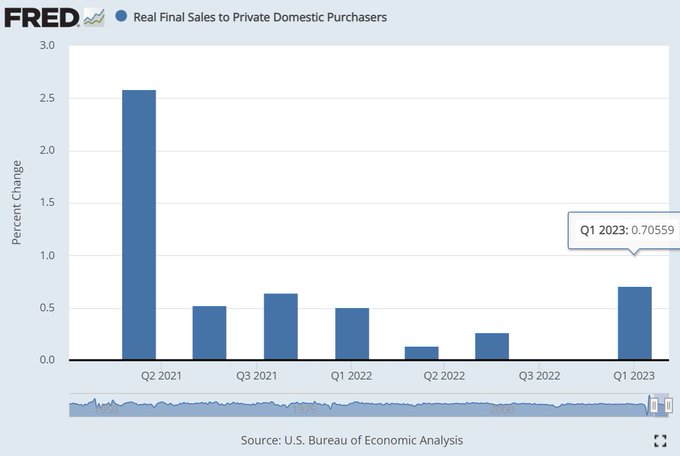
Reflecting on super Q1 GDP.
+1.1% hides something much more solid than it was. Real private sales up, volatile parts good.
Net-net better than Q4.
Forward view comes down to non-resi investment.
FORWARD:
0-0.5% avg for 4 qtrs
Worst qtr -1 to -2% (ex-credit crunch)
1/
8
29
126
20/ There is another option...if the Fed continues with aggressive hiking, equity can be replenished by an injection from the government through more debt issuance.
This takes us full circle - the real money printing was the initial debt issuance all along. This is always true.
14
12
123
3/ It's when you look at the liabilities that the reason for why the B/S can't shrink all that much.
The structure of the financial system has changed a lot since the GFC through regulation and the fear of another contagion driving deposits far more than they did pre-2007.
1
5
122
8/ This is a change mostly from regulation, permanently increasing the BS size.
This puts the minimum Fed balance sheet size so far at currency ($2.3trn) + RRP ($2.3trn) = $4.6trn.
4
8
119
Markets usually do what they feel, but I think the move in the curve is worth talking about.
The US curve steepened across the board the last 2 sessions while the short-end has sold-off.
Is the 10y back, with the short-end in the back seat?
Some theories.
1/
4
22
117
9/ Commercial Bank Reserves.
Excess reserves were at zero pre-GFC. This is because banks were searching for more return anywhere, driving short-term interbank lending.
This totally changed post-GFC because of regulation, and fear.
3
4
116
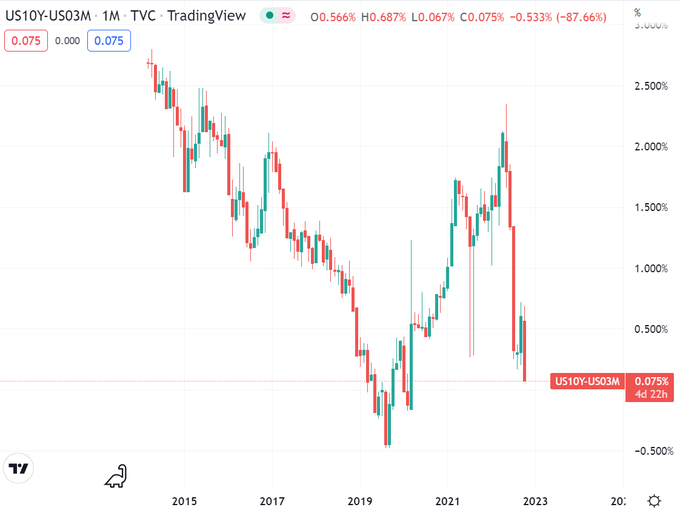
This bond rally is not at all what you would expect given the narrative around it.
A retreat from aggressive hikes should see the 2s10s curve STEEPEN, not FLATTEN.
It's flattened so much we are seeing the 10y v the 3 month rate inverted as well.
Stay away from longs.
1/
7
25
120
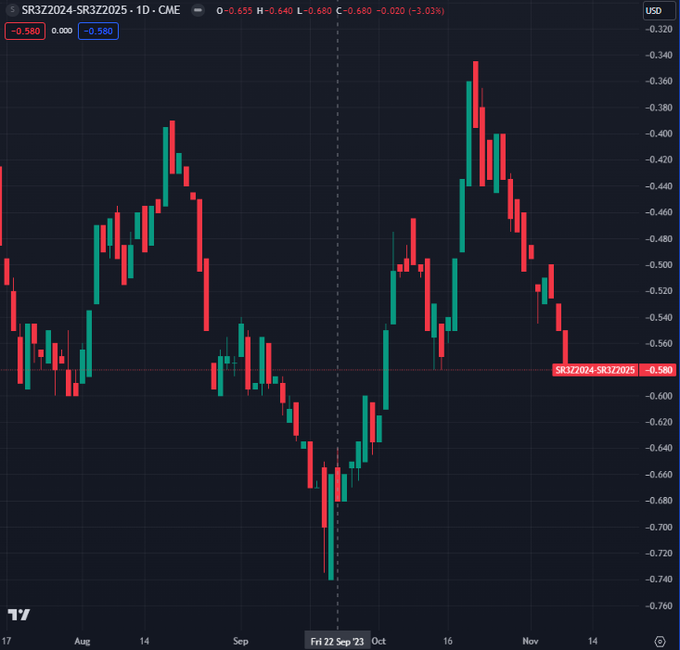
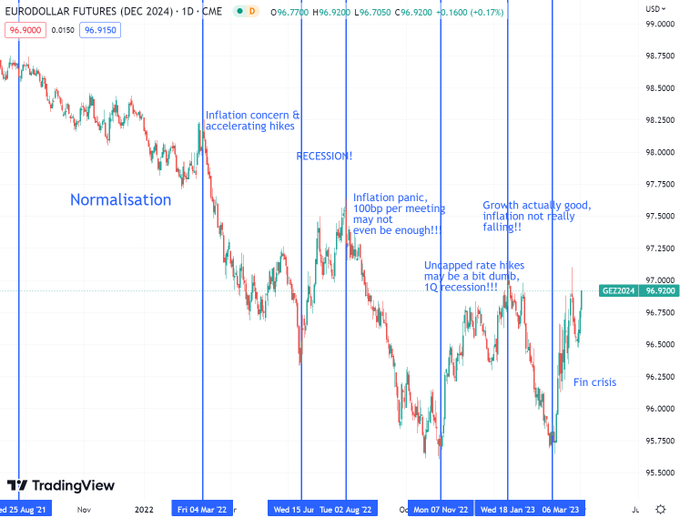
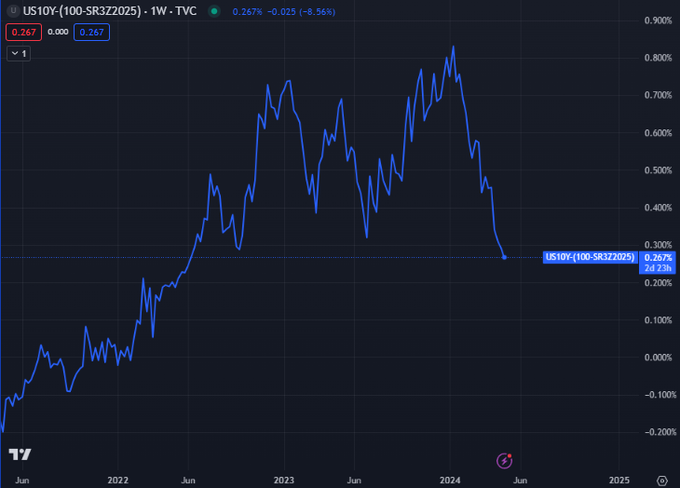
A trading guide to Dec-24 SOFR.
If we assume Jun is the last chance to start cutting before it gets called "election interference", then the effective trading range for SFRZ4 is 95.70 to 96.42.
This lines up with congestion areas. Any break and it's going to be messy...
1/
6
12
121
US10y still has an open path to 5.20%.
Most curves are indicating that we're finding a new range with a likely pause a bit higher. Longs most definitely aren't safe, or recommended.
5s10s have surpassed previous highs, showing positive slope...
1/
1
11
118
FF futures are back to pre-pivot levels, but risk is loving it. Why?
Level matters to risk less than:
1. The width of the future rate path
2. The vol of rates
Fed has convinced the mkt that growth++, low unemp with rate cuts isn't inflationary.
Do they truly believe this?
1/
3
19
117
2023/24 rates continue to drift higher, and they should move more.
The bank "crisis" and debt ceiling resolution are immediate catalysts, but these are less important than the "collecting pennies in front of a steam roller" nature of being short rates for a stuck Fed.
1/
2
23
117
4 charts that imply that the US economic slowdown is easing.
1. Senior loan officers survey: degradation has slowed, which points to carry trades in credit & higher bond yields.
Eco picture is adjusting to stable long rates. High rates may not matter.
1/
10
26
113
The "new money" liquidity index is barely positive for October, but it's not enough to arrest the falling moving average.
The indicator is at an extremely low level (next tweet), signalling a November out of equities.
The index has been out of equities since the end of Aug.
1/
5
16
107
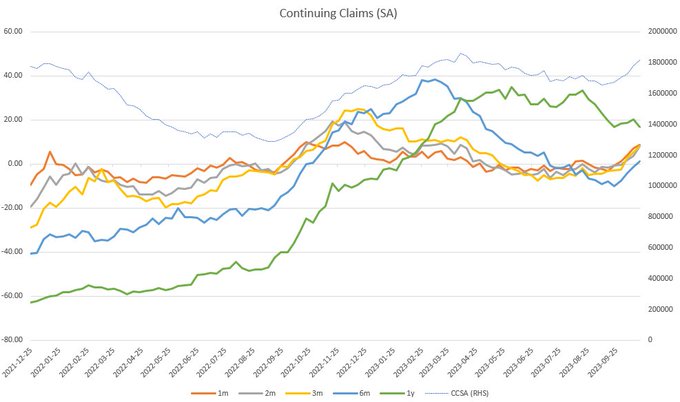
Continuing claims are starting another cycle with 1m, 2m, 3m & 6m delta in claims pointing decidedly higher now.
Last time this happened was in Oct-22, which aligned with an 85bp rally in US10s, from 4.25% to 3.40% (from a similar set-up as now, admittedly).
1/
7
11
106
The DEBT CEILING does nothing but serve politicians.
It does this by introducing a game of brinkmanship that allows the parroting of ideology for personal benefit and provides the arena for self-serving fighting.
The debt ceiling arena is the figurative "mud to the pigs".
1/

3
15
101
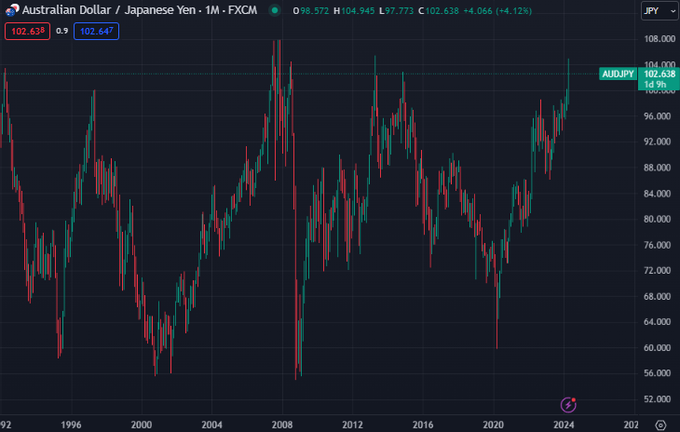
With all the excitement of USDJPY, interesting to note that AUDJPY is at modern extremes.
The classic risk barometer FX pair, it is known for taking the staircase up, and the elevator down.
Also has a strong daily return skew for this reason (similar to equities)
7
20
106
The US yield curve is flatter than any QRA since 2022, including the most recent.
Outsized coupon issuance should steepen the curve relative to forward Fed Funds expectations. This hasn't happened.
Term premium is not tradeable or observable outside of academic papers.
6
11
107
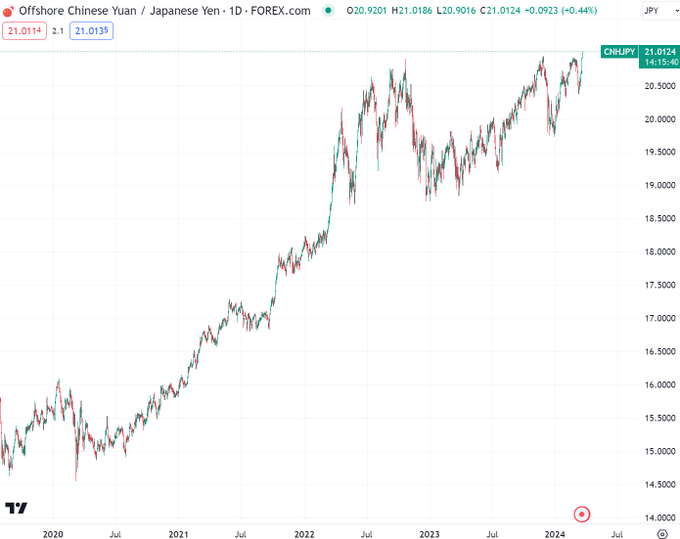
CNH/JPY hits new highs while the PBOC is easing and the BoJ has hiked for the first time ***since 2007***
Absolute masters of their craft. I might have to consider replacing the picture of Draghi on my wall with Ueda, and changing my name to "Count Uedula"
3
15
106
US front-end rates have accelerated higher after breaking support last week.
2024 rates are well in a new range, 2025 about to enter new territory.
Supply explanation dented by flattening (chart)...front-end has all the action, not 10s. This is about reversing inversion.
1/
6
16
104
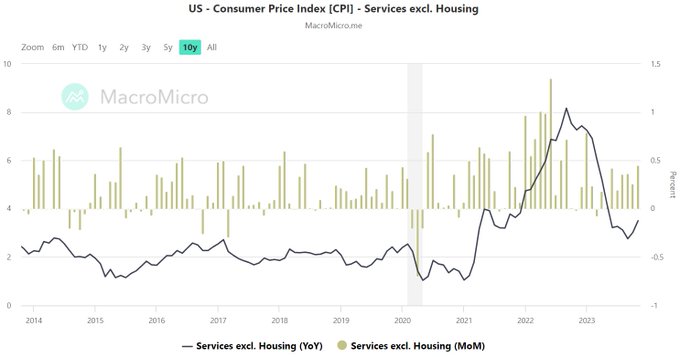
Core CPI: Goods disinflation and moderated shelter is hiding re-accelerating services inflation.
The question isn't if inflation is coming down - it's about where it sticks. And that isn't clear.
Persistent >3% core is problematic for the Fed.
3
11
103
A lot of confusion on how stocks go up when rate cuts are priced out.
Stocks won't meaningfully sell off until the Fed loses its easing bias.
That is when yield upside is opened up, and the market brings vol back big time.
Until then we are talking 1 cut vs 3...who cares.
12
10
103
Q3 US GDP prints an exceptional 4.87%, driven by consumption, government & inventories.
GDPnow was pretty good on this one, getting conumption & govt close enough, but overestimating non-res investment.
GDP in parts is below.
1/
7
10
101
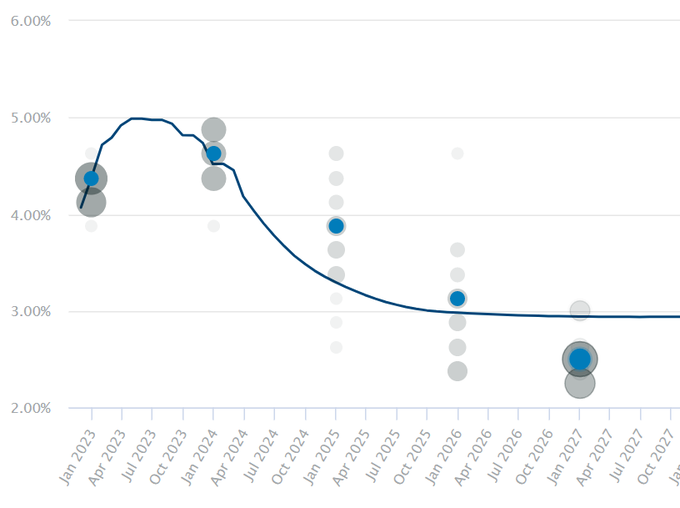
I'm sticking my neck out here, but here goes...
I really struggle with the idea of R* in an economy an economy where increasing debt delivers less and less NGDP per $. An economy that has almost 0% total factor productivity. R* doesn't matter here, so it becomes impossible to

The reason why I bring up the neutral rate is because I think the market is actively debating it without realizing it or explicitly saying so.
Much of the consternation around Fed pricing right now is how many cuts is appropriate this year, but that implies that cuts themselves
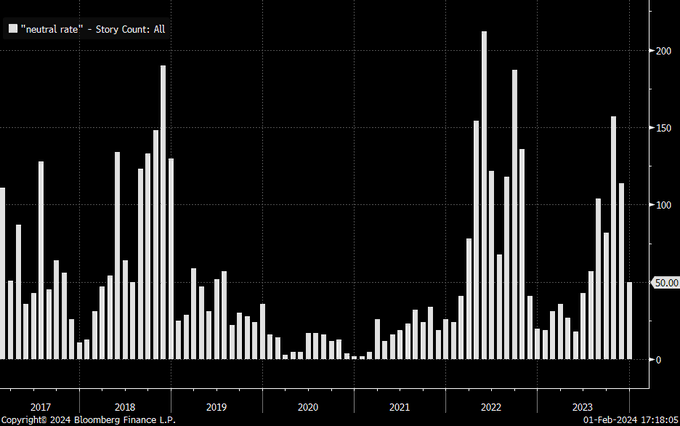
40
110
553
7
12
103
The argument for why the Fed will be reluctant to go back to ZIRP outside of a devastating financial crisis.
* Perceived inflation and deflation risks are more even than they have been in 20+ years
* The inflation cycle has been painful enough that psychology has changed
1/

17
11
99
7/ I expand on this more. Full newsletter below.

2
17
98
What an incredible US OIS yield curve.
2% worth of rate cuts priced mid-2023 to mid-2025, and we haven't even finished hiking yet.
4 x 25bp each year.
The market is betting big on low inflation and recession, and happy to take negative roll up the curve for it.
1/
5
17
98
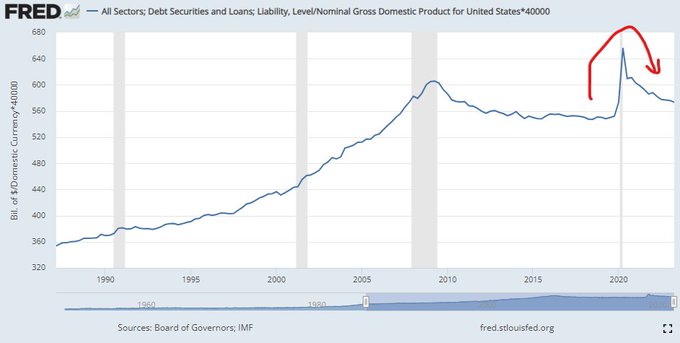
The ~24% rise in US nominal GDP since Q4 2019 has nearly wiped out the jump in debt-to-GDP as a result of the pandemic.
Of course this means that public debt is a growing share...and this discounts the drag of interest costs in the future.
[US total debt to GDP (%)]
1/
6
13
95
With 1 trading day left in March, the S&P is up ~3%, and the "new money" liquidity model banks a gain.
Strong month for new debt, +$230bn - govt doing the heavy lifting, bank loans absent this month.
This means I stay long the S&P
1/
9
7
97
My latest newsletter expands on my tweets outlining why the Fed is going to end QT next year...which will still leave it with $8trn of assets.
Being high-level, it should improve your understanding of how the Fed works.
1/

5
19
94
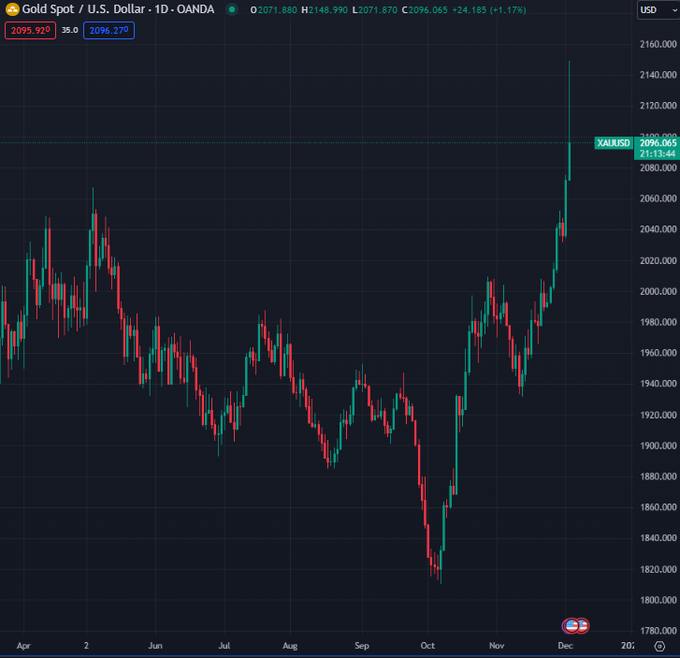
Moves like this make me real nervous
Credit will be in for a rougher time than equities, relatively speaking
6
8
94
Falling US bank NIMs are only relevant for equity val'ns, and that info has been priced.
Deposit betas are accounted for. The inv yield curve will flatten quickly if the fwd curve becomes truth.
US banks run a NIM of >3%.
Compare this to AU (<2%), EU (1.3%) & JP (0.5%!).
1/

5
15
91