

Steve Deppe, CMT
@SJD10304
Followers
16,357
Following
1,640
Media
7,385
Statuses
98,425
CIO at NDWM, Charts & Sheets lover, Sports Fanatic, *my tweets are not investment advice*
San Diego
Joined January 2010
Don't wanna be here?
Send us removal request.
Explore trending content on Musk Viewer
キスの日
• 269883 Tweets
Bronx
• 141545 Tweets
Taiwan
• 116042 Tweets
hoshi
• 90932 Tweets
INCOMPARABLE WINNER ELVISH
• 63787 Tweets
Kano
• 55776 Tweets
DILAW OUT NOW
• 36718 Tweets
Ticketmaster
• 32408 Tweets
LAYOVER DOMINATION
• 31001 Tweets
HBD YTSTAR ABHISHEK MALHAN
• 27974 Tweets
CONGRATULATIONS TAEHYUNG
• 27565 Tweets
Live Nation
• 26658 Tweets
Beetlejuice Beetlejuice
• 26530 Tweets
FELIX LOUIS VUITTON CRUISE
• 24615 Tweets
CSK BAAP OF RCB
• 23837 Tweets
NEWJEANS IS BACK
• 23509 Tweets
은호야 생일
• 19355 Tweets
FELIX ENAMORA A BARCELONA
• 16559 Tweets
Wanda
• 16290 Tweets
$Retik
• 15634 Tweets
$BEER
• 14795 Tweets
Paquetá
• 14697 Tweets
Claudio Iturra
• 12636 Tweets
Zverev
• 12274 Tweets
SummerSlam
• 12064 Tweets


Pinned Tweet

Good time for a reminder:
I share what I find interesting but nothing I find interesting is truly going to tell me, you, or the mailman where the price of anything is headed next.
The best decision, in almost all cases, is simply to stick to your long-term investing plan. $spy
2
0
40
@getnickwright
You gotta own this one Nick, the reason they’re down 0-2 is because LBJ and AD we’re atrocious tonight.
It’s ok to say it.
32
12
847
We've seen the $QQQ's trade down more than -2.5% during the day, yet finish in the green, 15 total times since 2003.
But - we saw it happen 46 times from 1999-2002.
40
91
688
It's official:
2022 goes in the books as the worst start to a calendar year (through April's close) in the S&P 500's history. Down roughly -13.3%.
Previous record was 1970's 4-month decline of -11.45%.
53
190
670
I didn't have time to share this yesterday but I find it hysterical.
The S&P 500 hasn't gained 2%+ on back to back days all that often.
But, it managed to do it on 3/15 & 3/16 here in 2022.
And it managed to do it on 3/15 and 3/16 in 2000 too.
We live in a simulation.
27
73
623
A calendar month where VIX drops 5 points or more and closes above 20, but the S&P 500 doesn't even gain 1%+ for the month?
That was N=1...Dec 2008.
Now it's N=2.
29
75
607
The last 7 weekly closes for the S&P 500?
4130.62
4136.25
4169.48
4133.52
4137.64
4105.02
4109.31
That's just a 1.57% range over 6 trading weeks and it's very, very rare.
(Most similar recent comparable is late April 2006).
25
80
562
10-year yields:
Today: 1.41%
2020: 1.41%
2019: 1.47%
2016: 1.37%
2012: 1.43%
S&P 500 today:
~4,560
S&P 500 2012:
~1,300
Will never understand those who think the 10-year is telling us where $SPX is headed.
19
66
469
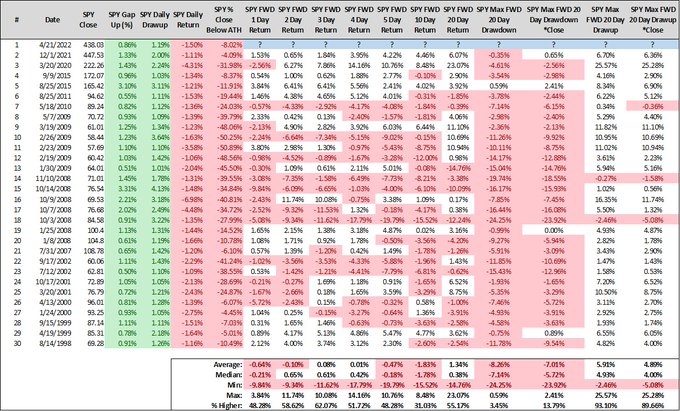
How's this for a random (ran-dumb) Saturday AM tidbit.
The S&P 500 has now closed more than -4% off its weekly high each of the last four weeks.
The precedent?
3/20/2020
3/6/2009
10/24/2008
(The index gained 10%+ the very next week in all three of those instances - lol).
40
70
465
Someone double check my work here but I don't show any other instances of $SPY falling -4% in a single trading day with the $VIX closing the same day under 30.
59
52
433
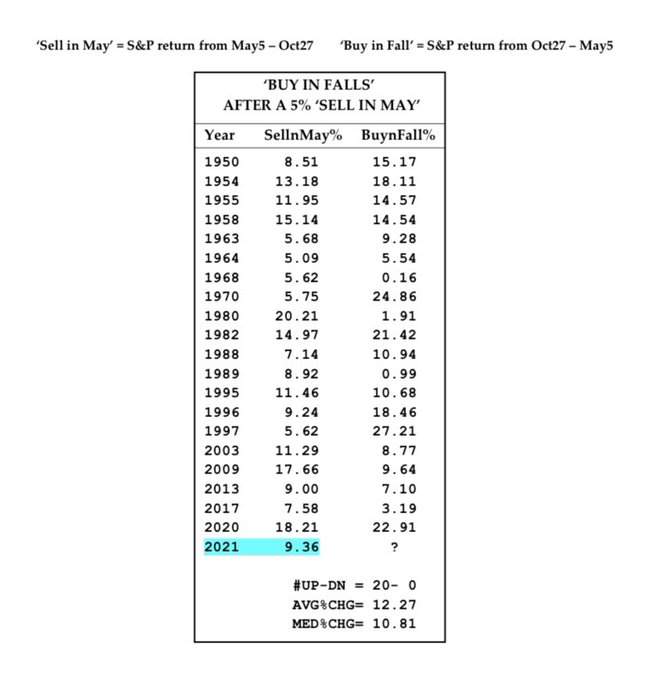
Saturday AM snippet from the OG Wayne Whaley.
When $SPX gains 5% or more from 5/5-10/27 (his own personal unfavorable period), the index has then never closed lower from 10/27 through 5/5 of next year.
A perfect 20-0 with rather absurd avg/med returns.
26
87
387
How about the $QQQ's down -4% or worse at its daily low only to finish the session in the green?
1/24/2022
11/13/2008
10/16/2008
7/15/2002
6/26/2002
10/19/2001
4/20/2001
2/23/2001
1/8/2001
12/26/2000
10/26/2000
6/2/2000
These dates are not bull friendly, short-term.
25
78
383
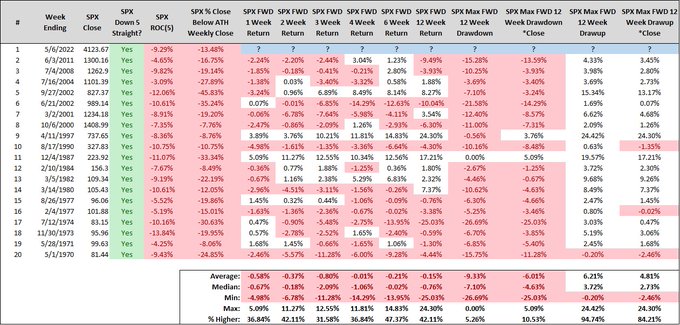
Just how many times has the S&P 500 declined 6 weeks in a row while losing -10% or more?
5/13/2022
7/11/2008
10/4/2002
8/24/1990
3/21/1980
5/8/1970
That's it, that's the list.
30
65
343
Ran-dumb:
$SPX trades up 3% or more during the day, yet closes red.
Only days that match.
10/29/2008 (my bday)
10/17/2008
10/14/2008
10/3/2008
11/6/1974
6/9/1970
1 thing in common - all lower 20 days out.
But, do *not* shoot the messenger. I know N=6, i typed the tweet!
23
79
332
The S&P 500 is on pace to close the last 12 days higher by 10%+.
A 12-day price thrust of this magnitude?
Here's the precedent since Y2K
Nov 2020
April 2020
Jan 2019
Oct 2011
March-July 2009
Dec 2008
Oct 2002
Aug 2002
April 2001
March 2000
(You all should know these months!)
21
48
310
$AAPL is about to finish an 8-day winning streak where the weakest daily return is 0.65% and yea the stock has never done that before.
(Came closest in 1989 at 0.62%)
16
33
283
We live in a world where those who speak the fanciest of options greeks gain all the follows & pretend to know every move - but its the idiot in the corner with 7 followers trading the 50-day moving average making all the money.
21
14
283
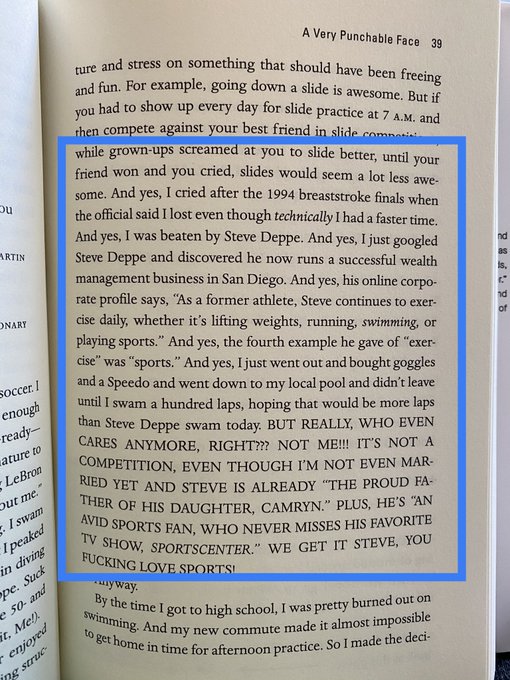
Got my copy of
@ColinJost
new book today.
Why?
Because he tells me to “Suck it, Steve!” on page 38 - but - then tells a cool story about us on page 39.
I think this is a top 3 highlight of my quarantine.


28
8
284
Whispers:
+4% to open the week when the following week was negative isn't a great sign...
5/10/2010
11/24/2008
10/13/2008
9/8/1998
10/7/1974
Yes, whispers. Don't listen to me.
11
49
269
Oh look, it's the 1st time this century where $SPX gained 1% or more...with $VIX closing up 5%.
Figures.
10
52
266
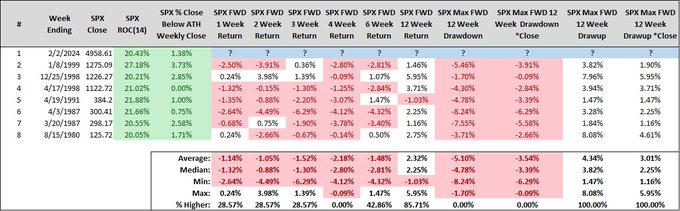
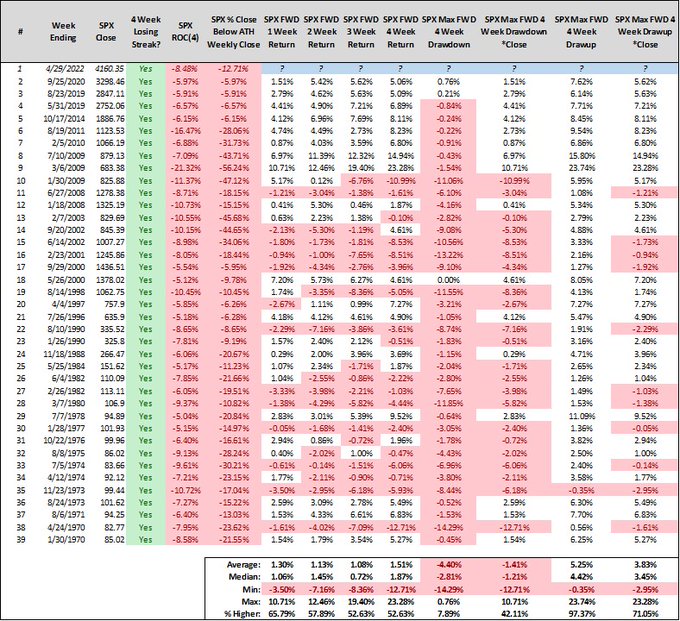
When is the last time the S&P 500 gained 4%+ in a week while closing within -10% of its ATH weekly close after having declined -5% or worse the trailing 12 weeks?
Week ending 11/30/2018.
Read
@hmeisler
pinned tweet & don't fall victim to overconfidence.
Stay disciplined!
30
25
268
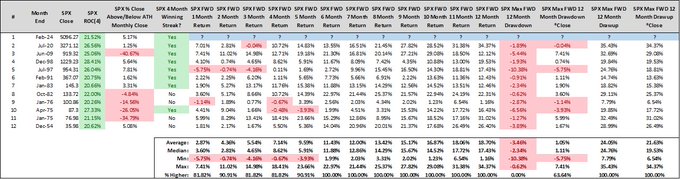
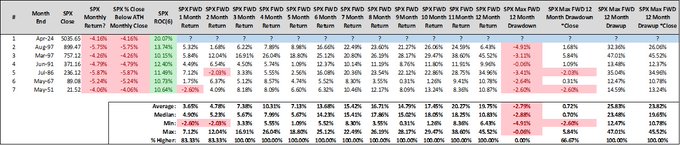
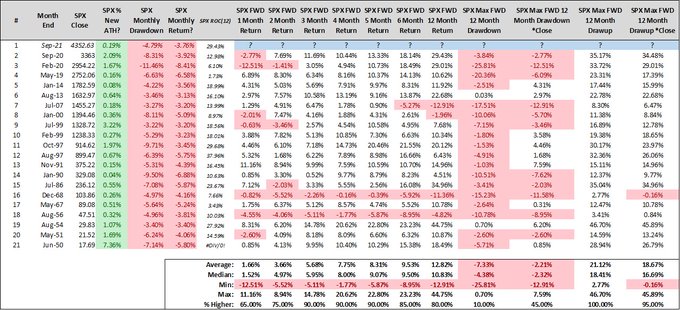
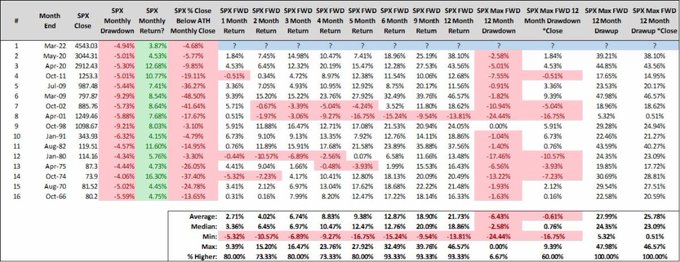
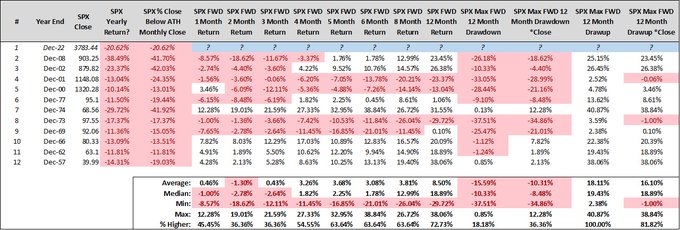
When the S&P 500 ends a 3-month losing streak by gaining 3%+ in month 4, and doesn't close at a new all-time high monthly close, it has been the best sign that the correction has run its course that I've ever stumbled across.
Monthly close > 4,319 to confirm.
In other words,
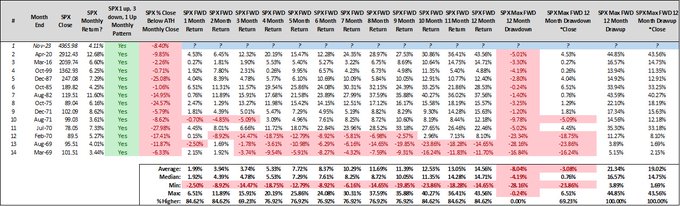
24
46
270
Another interesting tidbit as we head into March.
The S&P 500 is 4 trading days away from a 4 month winning streak ending in February.
4-month winning streaks ending in February have then never seen the S&P 500 close the remainder of the current calendar year lower.
13 for 13
18
47
264
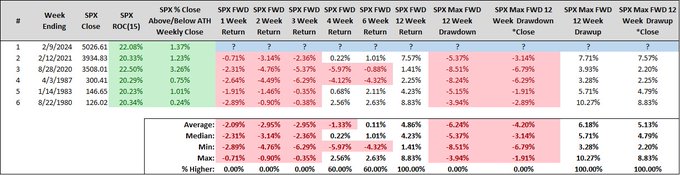
Random:
What happens after the S&P 500 gains 20% or more over the trailing 14 weeks & closes at a new all-time high?
Well, N=7 but it's never closed higher 4 weeks later so maybe the bears are pounding their chest over a -3-5% pullback on March 1st.
(You know what to do from
13
56
250
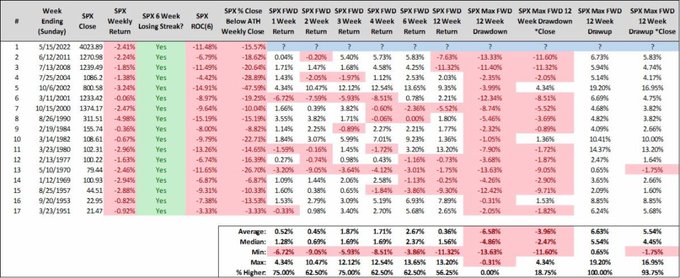
That's now a 5-week losing streak for the S&P 500, the 20th since 1970, which I think most would believe precede really strong market climates over the forward 3 months.
But that belief would be "just a bit outside!"
14
58
248
So yea the S&P 500 has never declined -4% or more on a trading day in the month of May (at least not since 1970).
So, decent chance we're seeing the worst trading day in May over the last 50+ years.
25
34
237
This was COVID’s gift. Without it i’d probably have never built this out. It will be the gift that keeps on giving, since i’m hopefully living here for decades.
Almost done & highly recommended.
(dumbbells, FID bench, trap bar, and mats might arrive by 2021)

42
5
240
Consecutive trading days where the S&P 500 was up 1.5% or more during the session, yet finished both days in the red?
All we got since 1950:
10/10/2008
10/9/2008
10/8/2008
13
36
234
Random:
Today marks just the 6th time in the history of the S&P 500 that the index finished a calendar week with trailing 15-week returns of >= 20% and at a new all-time high weekly close.
Ironically, we were in almost the exact same position exactly 3 years ago.
23
47
242
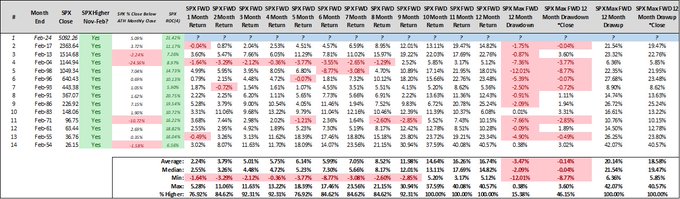
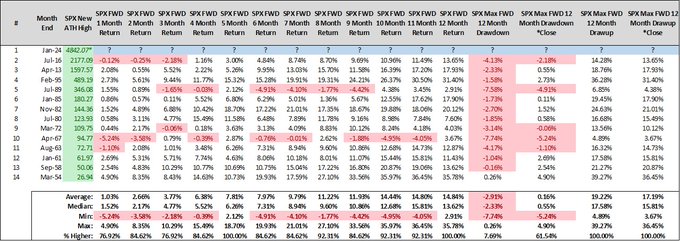
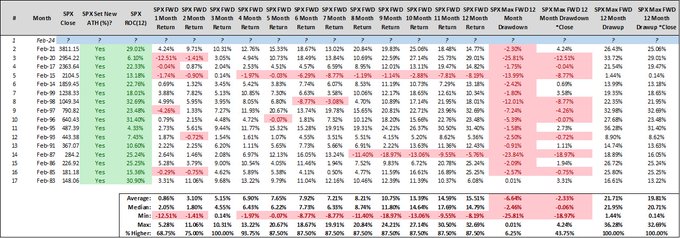
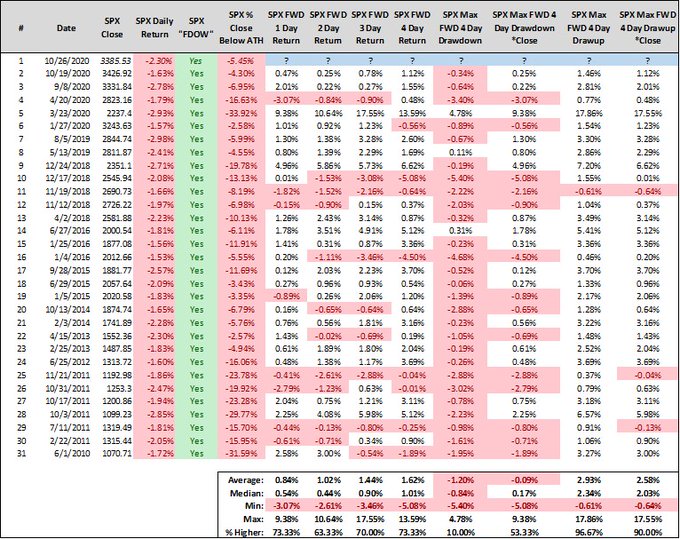
The S&P 500 is on pace to finish the month of January with trailing 4-month returns of 10% or more and trailing 12-month returns in negative territory.
Here's the precedent - and it's easily one of the most lopsidedly "bullish" tables i've ever posted. $spy
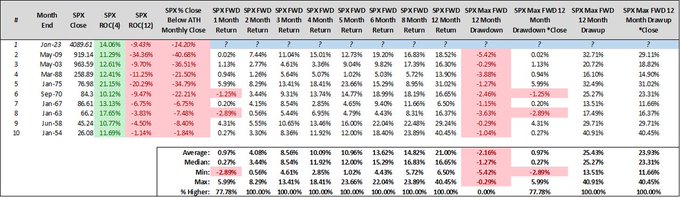
7
53
240
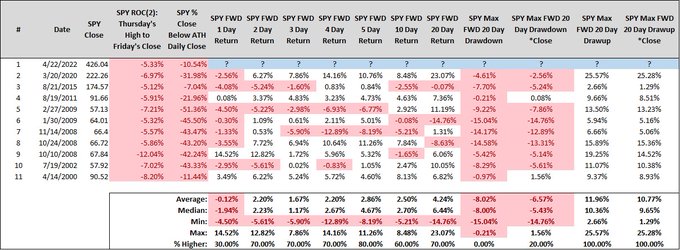
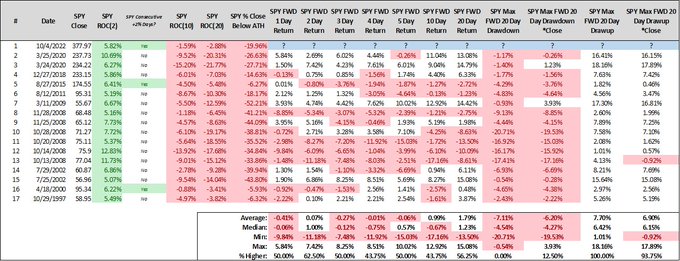
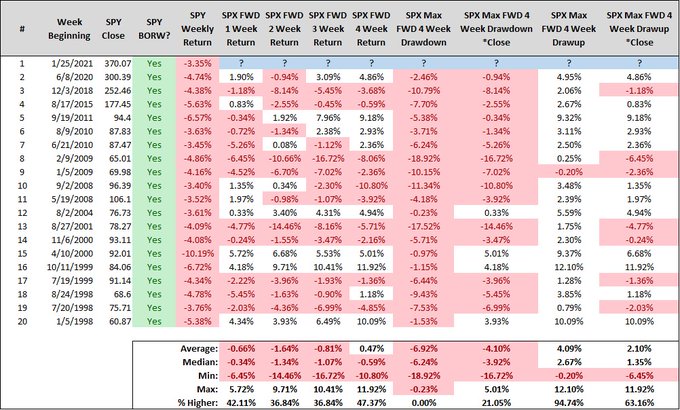
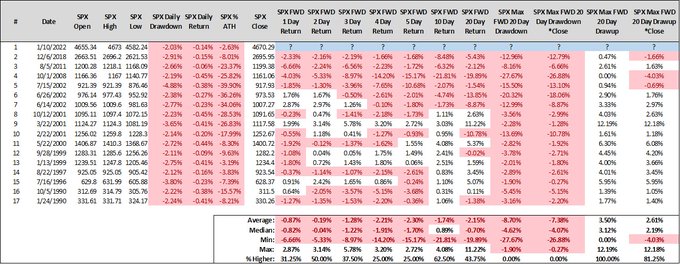
Ran-dumb:
$SPY just plunged -5%+ from Thursday's high to Friday's close.
That's really rare.
All I've got below (someone check my work please!)
Maybe a "flush" on Monday and a "Turnaround Tuesday", which means we'll probably get the opposite.
21
56
227
“Stocks are up ~200+ handles in 3 trading days they’re so due for a pullback.”
“But didn’t we just have a -5% pullback?”
“Yea but you can’t just rip ~200 handles in 3 days. We need a pullback.”
Tell me you didn’t buy the pullback without telling me you didn’t buy the pullback
10
11
212
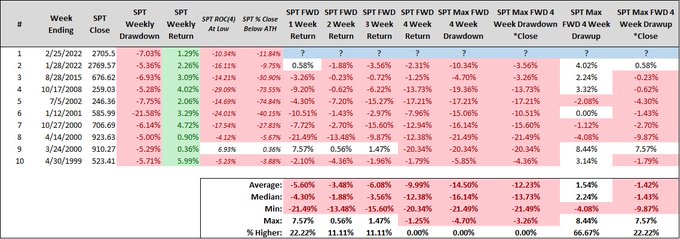
The S&P 500 Technology sector traded down -5%+ last week, yet finished the week in the green.
Surely that sort of upside reversal must mean the bottom is in for Technology, right? Right??
“Just a bit outside!”
32
37
217
I want to see $SNAP burned to the ground, head right to $0, and I imagine every father with a 12-18 year old daughter feels the exact same way.
18
9
190
I'll make a prediction.
$IWM absolutely trounces $SPY in 2021.
Anyone else feel this way?
44
16
190
A 3-day losing streak that declines -3% or more & then gains 1%+ on day 4 has then closed day 5 lower 21 of the last 28 times.
Try reading that 5 times fast.
A green day tomorrow would be impressive resilience. $spx
13
31
182
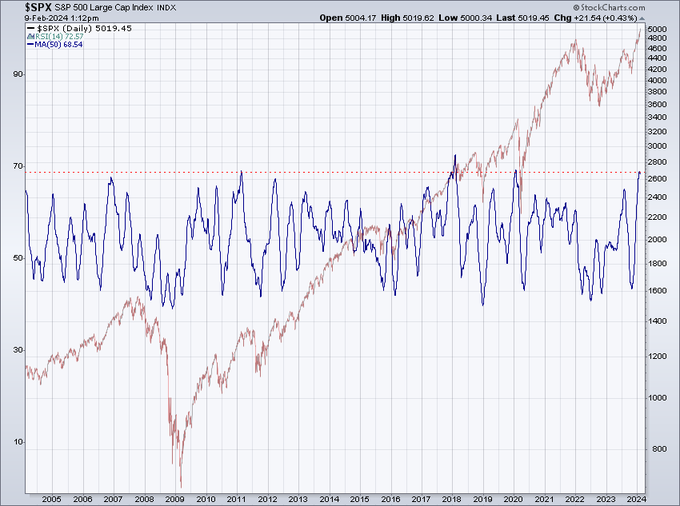
50 day SMA of RSI(14) on the daily for $SPX is knocking on the door of 70.
This hasn't happened often the last decade plus and prices don't move linearly forever guys.
#SPX
cc:
@MacroCharts
14
31
183
As if we needed more bullish historical precedent.
The S&P 500 just gained 20%+ over the trailing 4-months.
Naturally, so many believe "this can't continue!".
Ha.
(Someone check my work here please!) $spx
14
26
183
Oldest child turned 13 today and i’m not even 40 yet.
Is that winning or losing, I have no idea.

45
0
170
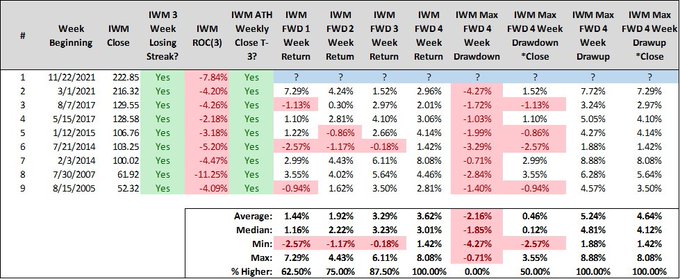
Re: $IWM, the trailing 4 week pattern is an all-time high weekly close followed by a 3 week losing streak.
Since inception, she's then never closed lower 1 month later.
She's mostly hated right now, and the chart is a mess, so I like her here and now.
16
24
170
So the S&P 500 just broke out to a new ATH here in January, after not having set a new ATH at any point over the preceding 12 months.
Here's the precedent and it is best used to help you tune out the noise and realize that yes, this can continue. $spx
11
25
167
@getnickwright
Old guy *half.
He isn’t doing much of anything in this 2nd half (offensively) and that’s why the broadcast is correct in their assessment.
Take the ball, Lebron. It’s simple.
10
3
161
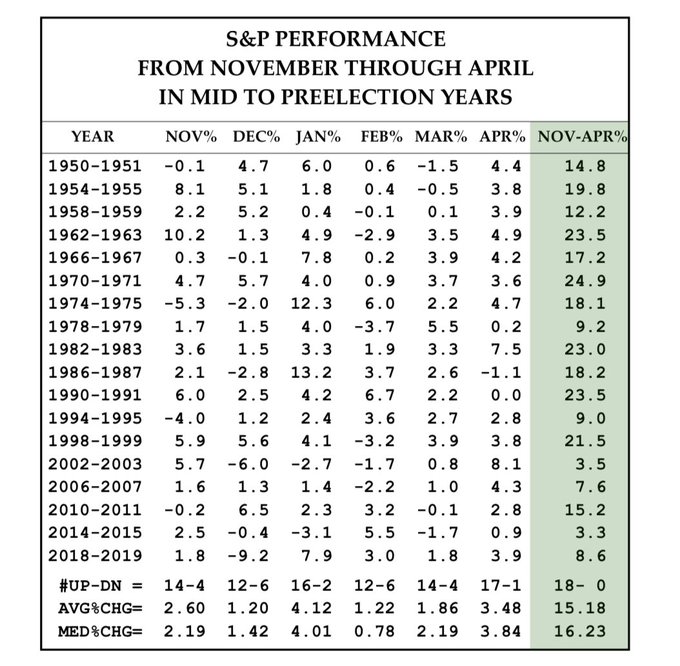
How's this for a random Sunday AM tidbit, courtesy of the great Wayne Whaley. (Sign up at )
From Nov of a midterm election year through April of a pre election year the S&P 500’s never closed lower. Average returns through the ceiling.
17
36
161
Ran-dumb:
$SPX +1% or more with $HYG down -0.50% or worse?
Hasn't happened since 05/03/2010.
Who remembers what happened 3 days later?
Who wants to bet me whether this will happen on 04/29? $spx
23
34
156
The S&P 500 up 1% or more 6 of the last 8 trading days?
Only dates that match since 1970:
3/24/2022
11/9/2020
10/21/1974
10/18/1974
4
16
149
Well, we did it again.
The S&P 500 Technology sector traded down -5%+ this week, yet finished the week in the green.
Maybe the 10th time will be the charm here.
Updated table below and original tweet in the thread.
12
46
154
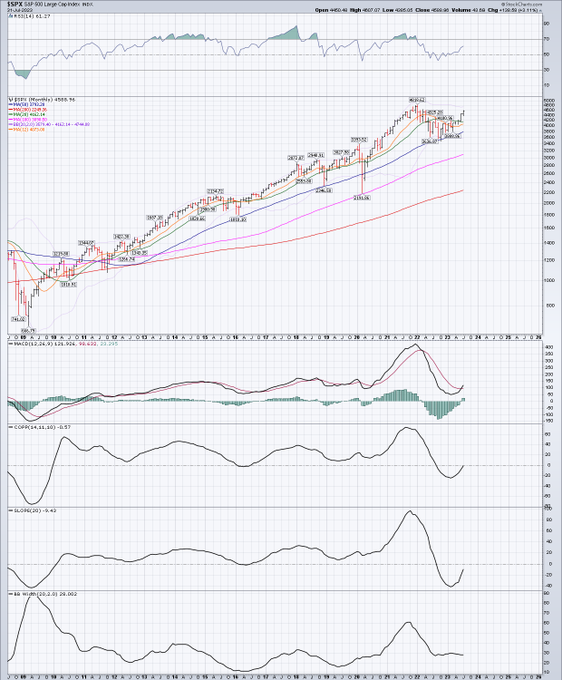
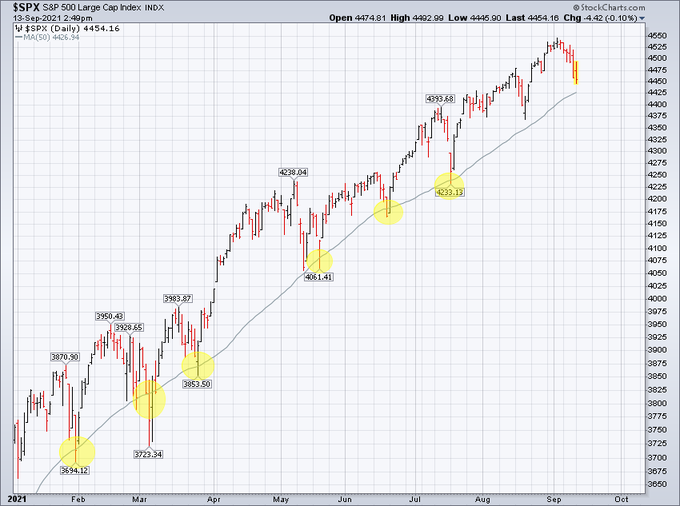
FWIW, every "indicator" on this monthly chart is positioned as if the party is just getting started, not about to be broken up.
(No, none of these "indicators" guarantee us anything, other than telling us where price has already been). $spx
18
36
154
Yea, that's never happened before.
We did it fam, more unprecedented stuff put on the board since we live in unprecedented times.
11
5
144
There's an eternity left in the month of February & I have no idea how the month will shake out - but - the S&P 500's already set a new ATH here in February & since 1970 that's been a flawless sign of a higher monthly closing price over the forward 3 months. $spx
13
35
151
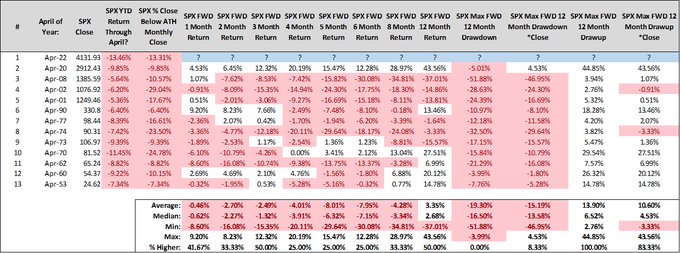
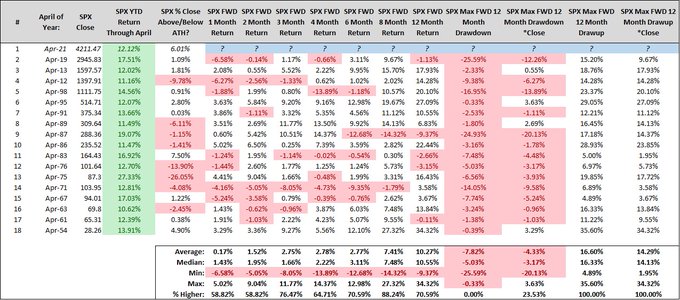
Here is what the rest of the year has looked like when the S&P 500 ends the month of April down -5% or worse on the YTD scorecard.
I suppose the question is:
Can the
@federalreserve
can do it again?
Are you feeling lucky?
15
39
144
One of the closest "fits" (I know!) to the last 26 days of trading is 4/25/2000 & that 8.91% rally over 6 days was arguably one of the best days to press sell in the history of the $SPY.
The next closest was 11/4/1997 & that was one of the best days to press buy for $SPY.
12
22
142
Random:
The S&P 500 recorded a 2-month pattern of:
1) All-time high monthly close last month
2) -3% or worse decline this month with trailing 6-month returns of 10% or more.
Sounds like it's a warning sign. I thought it'd be a short-term warning sign.
Instead, all white.
14
27
147
6 straight trading days with an open that's greater than the close?
Only the 22nd time we've seen that since 1990 - which I found very surprising (someone check my work) - but the S&P 500's forward 4 day return is then 18-3 for +1.21% on average.
7
18
142
Consensus expectation was for a shit show.
We got a shit show.
Consensus expectation was the market would *not* like a shit show.
The market loves the shit show.
What a shit show.
5
16
139
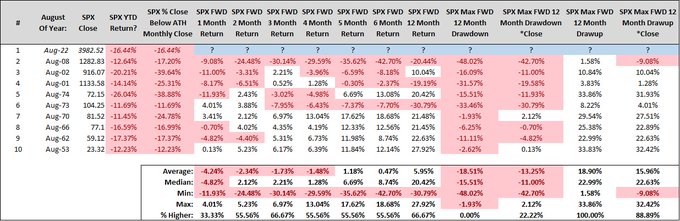
The S&P 500's year-to-date return through August is going to finish below -10% (presumptive, not going out on a huge limb here...)
Here are all calendar years that were down -10%+ through the month of August.
Stating the obvious here, I think, but things are going to get crazy.
12
27
139
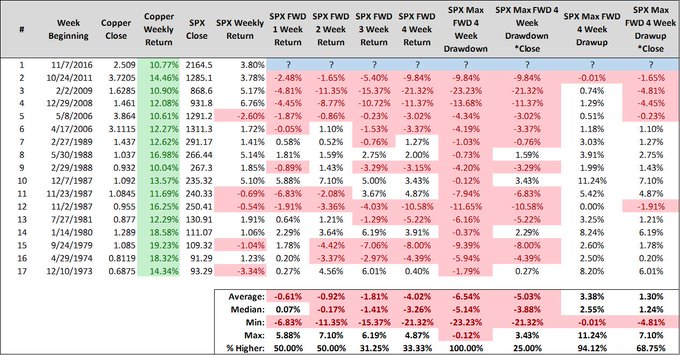
$SPX loses -1% or worse for the week & $VIX falls -5% or worse for the week?
Not the norm, and not predictive of anything, but the last 2 samples marked the bottom.
Weeks beginning:
11/12/2012
12/12/2011
14
37
132
So I dial up the CPU and say to myself:
"September smells like distribution. A new all-time high and now flirting with a monthly return of -3% or worse?? That has to precede some selling pressure, right?"
Wrong.
I find stuff this lopsided totally fascinating.
13
23
135
Random:
Here are all instances of $SPY gaining 5% or more over 2 days while also finishing with negative trailing 10 and 20 day returns.
Some crazy dates in here.
13
21
127
Is now a good time to let you know that the month of April has seen the S&P 500 close higher 14 of the last 15 years for +2.98% on average?
13
28
124
I've often tweeted how nothing can troll like the price action in the S&P 500 and I think the last two weeks are first ballot troll worthy.
The index rises for 16 of 18 weeks, rips more than 20%, and then records a 2 week losing streak that falls......
-0.39%.
16
12
125
Just how rare is an "inside day" for $SPY that returns 2% or more?
All we have here:
10/17/2022
3/4/2020
8/26/2015
2/24/2009
1/21/2009
12/2/2008
11/7/2008
10/30/2008
5/13/2002
4/17/2000
4/5/2000
10/31/1997
14
12
124
3 trading days away from the S&P 500 recording its 4th consecutive all-time high monthly close.
Here's the precedent - no comment necessary. $SPX
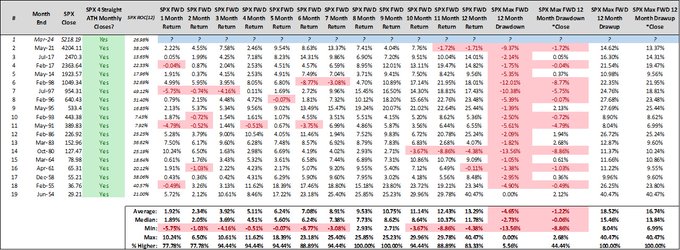
12
26
125
Just how rare is a 3 day pattern of:
+2% or more
-2% or less
+2% or more
For $SPY?
Here's all we got:
10/17/2022*
3/30/2020
3/17/2020
3/4/2020
8/11/2011
12/5/2008
6
16
123
So Friday the 13th brought us a 6 week losing streak for the S&P 500, the first time in a decade.
Here is how the index behaved following all prior 6 week losing streaks since 1950.
9
35
119

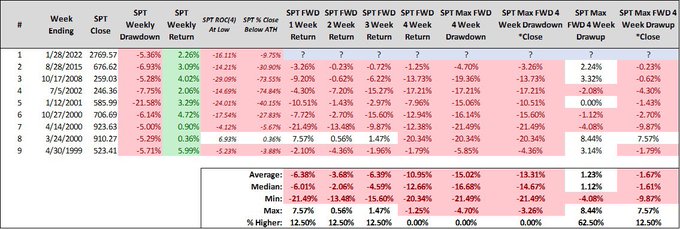
Ran-dumb:
The S&P 500 gained more than 1% this week, but also closed more than -2% off it's weekly high, all while finishing within -10% of its ATH weekly close.
We haven't seen this since August 2007...and before that April of 2000...and before that August of 1998.
20
19
117
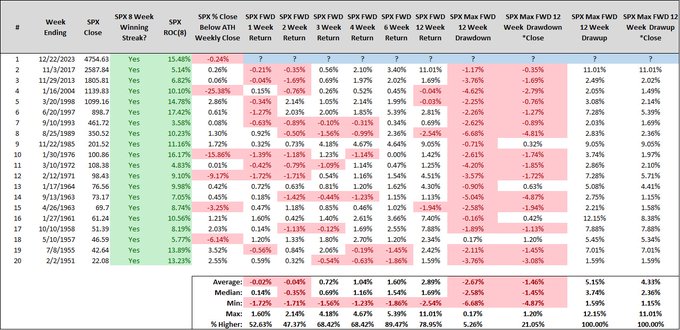
Put it in the books - that's an 8-week winning streak for the S&P 500. $spx
Here's the precedent (ROC 8 & % close relative to ATH weekly close for additional context only).
6 weeks out we've closed higher 17 times in a row.
8
25
120
Ran-dumb:
All trading days that saw the S&P 500 close red, with trailing 20-day returns of -3% or worse, with the $VIX falling 2 points or more on the session?
3/10/2022
4/3/2020
3/31/2020
3/23/2020
3/20/2020
8/25/2015
7/2/2010
11/3/2008
8/20/2007
9/18/2001
8/7/1990
9
28
112
If the S&P 500 can manage to finish the month of March higher by 3% or more (currently up 3.87%), after being down -4% or worse earlier in the month, then this is the precedent following this sort of bullish reversal month.
8
21
115
Ran-dumb:
When $SPY pairs a bearish outside reversal week with a -3% weekly decline or worse.
Wasn't expecting it to be this red the next month.
Seatbelt light's on.
6
21
112
Ran-dumb:
When $SPX kicks off the trading week declining between -1.5% to -3%, what's the rest of the week looked like?
It looks to me like the Bulls land a nice counter punch more often than not.
Fun rest of the week awaits.
12
21
114
So $SPY's now 15-3 the last 18 days for +10.80%.
There are lots of 18 day stretches that gained 10.80% or more.
But there are no 18 day stretches for $SPY that gained 10.80% or more and closed higher 15 of 18 days....until *today*.
(The last five 15-3 stretches over 18
12
18
116
The S&P 500 red, or even down -1% or worse, and the VIX Red?
Yes, we've seen it before.
Yes, it sometimes has marked bottoms.
Yes, it sometimes hasn't marked bottoms.
No, it isn't telling you the future.
7
14
112
What's the largest weekly decline the S&P 500's recorded over the last 7 weeks?
-0.10%.
That's it.
5
12
113
"Honey, how was your day?"
Well, the market had its 2nd worst day ever since 1950.
"Well, how about your week? Are you having a good week?"
Nope, probably the 2nd worst week on record since 1950.
"Month??"
Nope, probably the 2nd worst month on record since 1950.
Drink.
2
20
109
Worst Q2's in the S&P 500's history?
6/30/1962-21.28%
6/30/1970-18.87%
6/30/2022-15.54%* (one day left)
6/30/2002-13.73%
6/30/2010-11.86%
7
22
109
I haven’t had a “bank account” in a decade plus.
Every penny to my name is in brokerage accounts, one of which operates identically to a checking account.
Everyone’s situation is unique but I think most people should probably ditch their “bank account”.
Rebuttals welcomed.
39
2
105
Another ominous sign for August:
The S&P 500 closed July at an ATH but $VIX also closed up for the month & finished >15.
SPX closed the next month lower 6 in a row & 8 of 9 for average declines of -1.75% (-2.64% the last 6).
Imagine the horror of not rising 7 months in a row.
6
13
104
Let's just pretend for a minute that the S&P 500 does indeed go on to record an 8-week winning streak this Friday.
That would be the 20th such instance since 1950, the first since Nov 2017, and the great irony here is that the indexes forward 6-week return following 8-week
8
14
105
The S&P 500 has gone streaking & not in a good way.
Beauty is in the eye of the beholder & there's something for everyone when looking at the variety of streaks the index is putting up into today's close.
To start, here are 4-week losing streaks that declined -5% or worse:
9
25
98
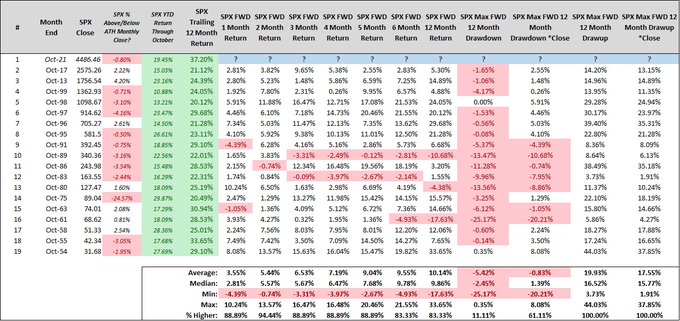
I think it's safe to say that the S&P 500 is going to finish the month of October with trailing 12 month returns greater than (or equal to) 20%.
Here is what the index has done following every other October that finished the same way (+20% yoy).
"This can't continue!"
Uh huh.
15
22
100
So $SPY gapped up 0.50% or more (ES, you liar!), traded up 1% or more (made me feel all good about a move to March's high!), and then closed down -1% or worse (damn you!).
A true "pump & dump".
Here are all trading days that match.
(T+10 stands out...and not in a good way)
14
19
98
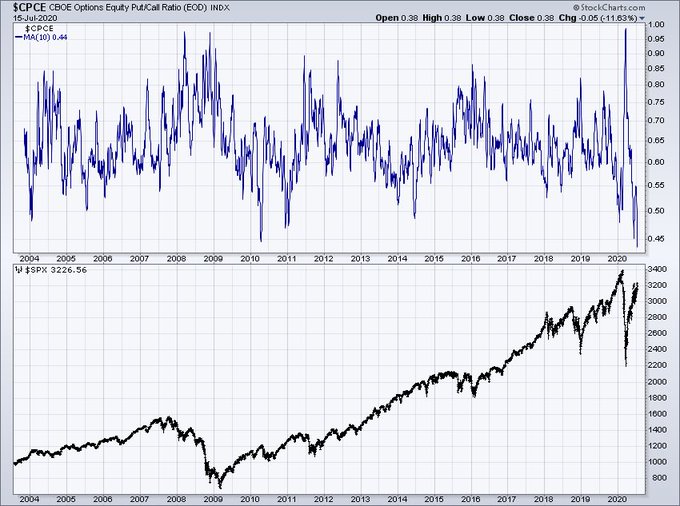
Congrats everyone, again.
Over the last 10 days we've managed to hate the puts, relative to the calls, more than all other trailing 10 day periods the last 18 years.
All of em.
7
36
97
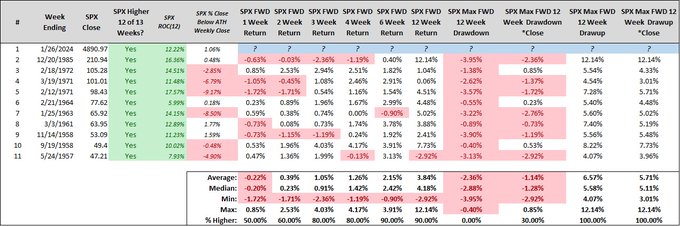
The S&P 500 rises 12 of 13 weeks?
I am stunned at how rare this is. Would have bet big money that we saw this more recently than back to December 1985.
Would have lost big money.
(Too rare to mean anything but it definitely doesn't mean the world is ending...) $spx
5
21
98
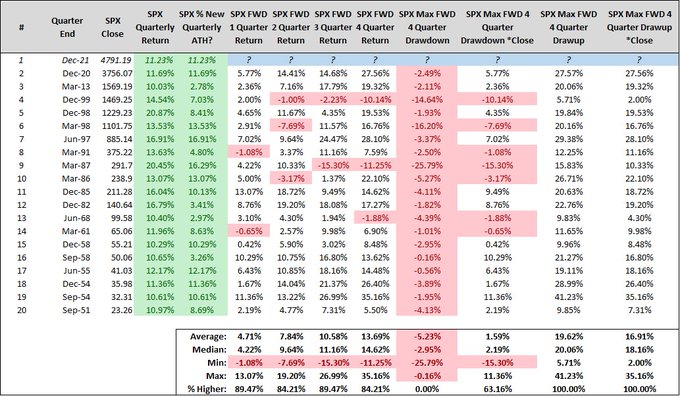
"The S&P 500 gaining 10% or more over a calendar quarter and finishing at the highest quarterly close in the history of the index has been a harbinger of doom!"
Said nobody ever.
4
25
98
The S&P 500 is currently down more than -20% year-to-date here in 2022 with just a few days remaining.
Investors can't wait to turn the page to 2023 but generally when the S&P 500 loses double digits in a calendar year things don't exactly just turn for the better come January.
5
30
93
Did you know?
When $SPX finishes the month of August in the red, but is higher by 10% or more on a YTD basis, the rest of the year’s higher 100% of the time for average returns of 8.88%.
What’s the luckiest number in China?
8
Go figure.
10
12
92
Today felt great for the Bulls, right?
Well, let this be a reminder that feelings have absolutely no place in the decision to press buy or sell.
We've seen this OHLC 16 times since 1990 (-2% daily drawdown, close between -0.50%-0.
Here is the S&P 500's next month.
9
21
93
There are 3 trading days since inception where $SPY declined -2.5% or worse and the $VIX closed lower on the day:
3/23/2020
3/20/2020
7/18/2002
Today increase of 0.05 records as the 4th smallest daily change for $VIX on days where $SPY falls -2.5% or worse.
12
15
86
The S&P 500 will *probably* finish the month of April higher by 10% or more for 2021.
The rest of the year's then gone 15-2 for average gains of 7.4% the forward 8 months.
3
20
87
$IWM with a chance to beat $SPY by 3% or more too.
Only dates that match:
4/9/2020
3/19/2020
10/4/2011
10/31/2008
10/10/2008
6/2/2000
7
20
83
Assuming we close higher by 4%+, that would mark just the 3rd time $SPY closed yesterday with positive trailing 20-day returns and then surged 4% today.
The dates:
11/10/2022*
12/16/2008
4/18/2001
That 12/16 date alone should keep us all from putting 100% of our IRA in $UPRO.
3
9
85
@arielhelwani
Excessive worry over fingers - no worry over 294 punches unanswered.
This guy should never ref a fight again in his life.
#UFC251
1
1
80